Median prices were up year-over-year in July, showing San Francisco real estate continues to be a healthy market albeit not has “gangbusters” as we’ve seen in years past. After years of weak inventory we’re seeing an influx of new listings particularly in the condo market, with some neighborhoods seeing buyers market levels of inventory available. Currently it’s a mixed market with both prices and inventory rising, and single family homes seeing greater demand than condos. See all the stats below.
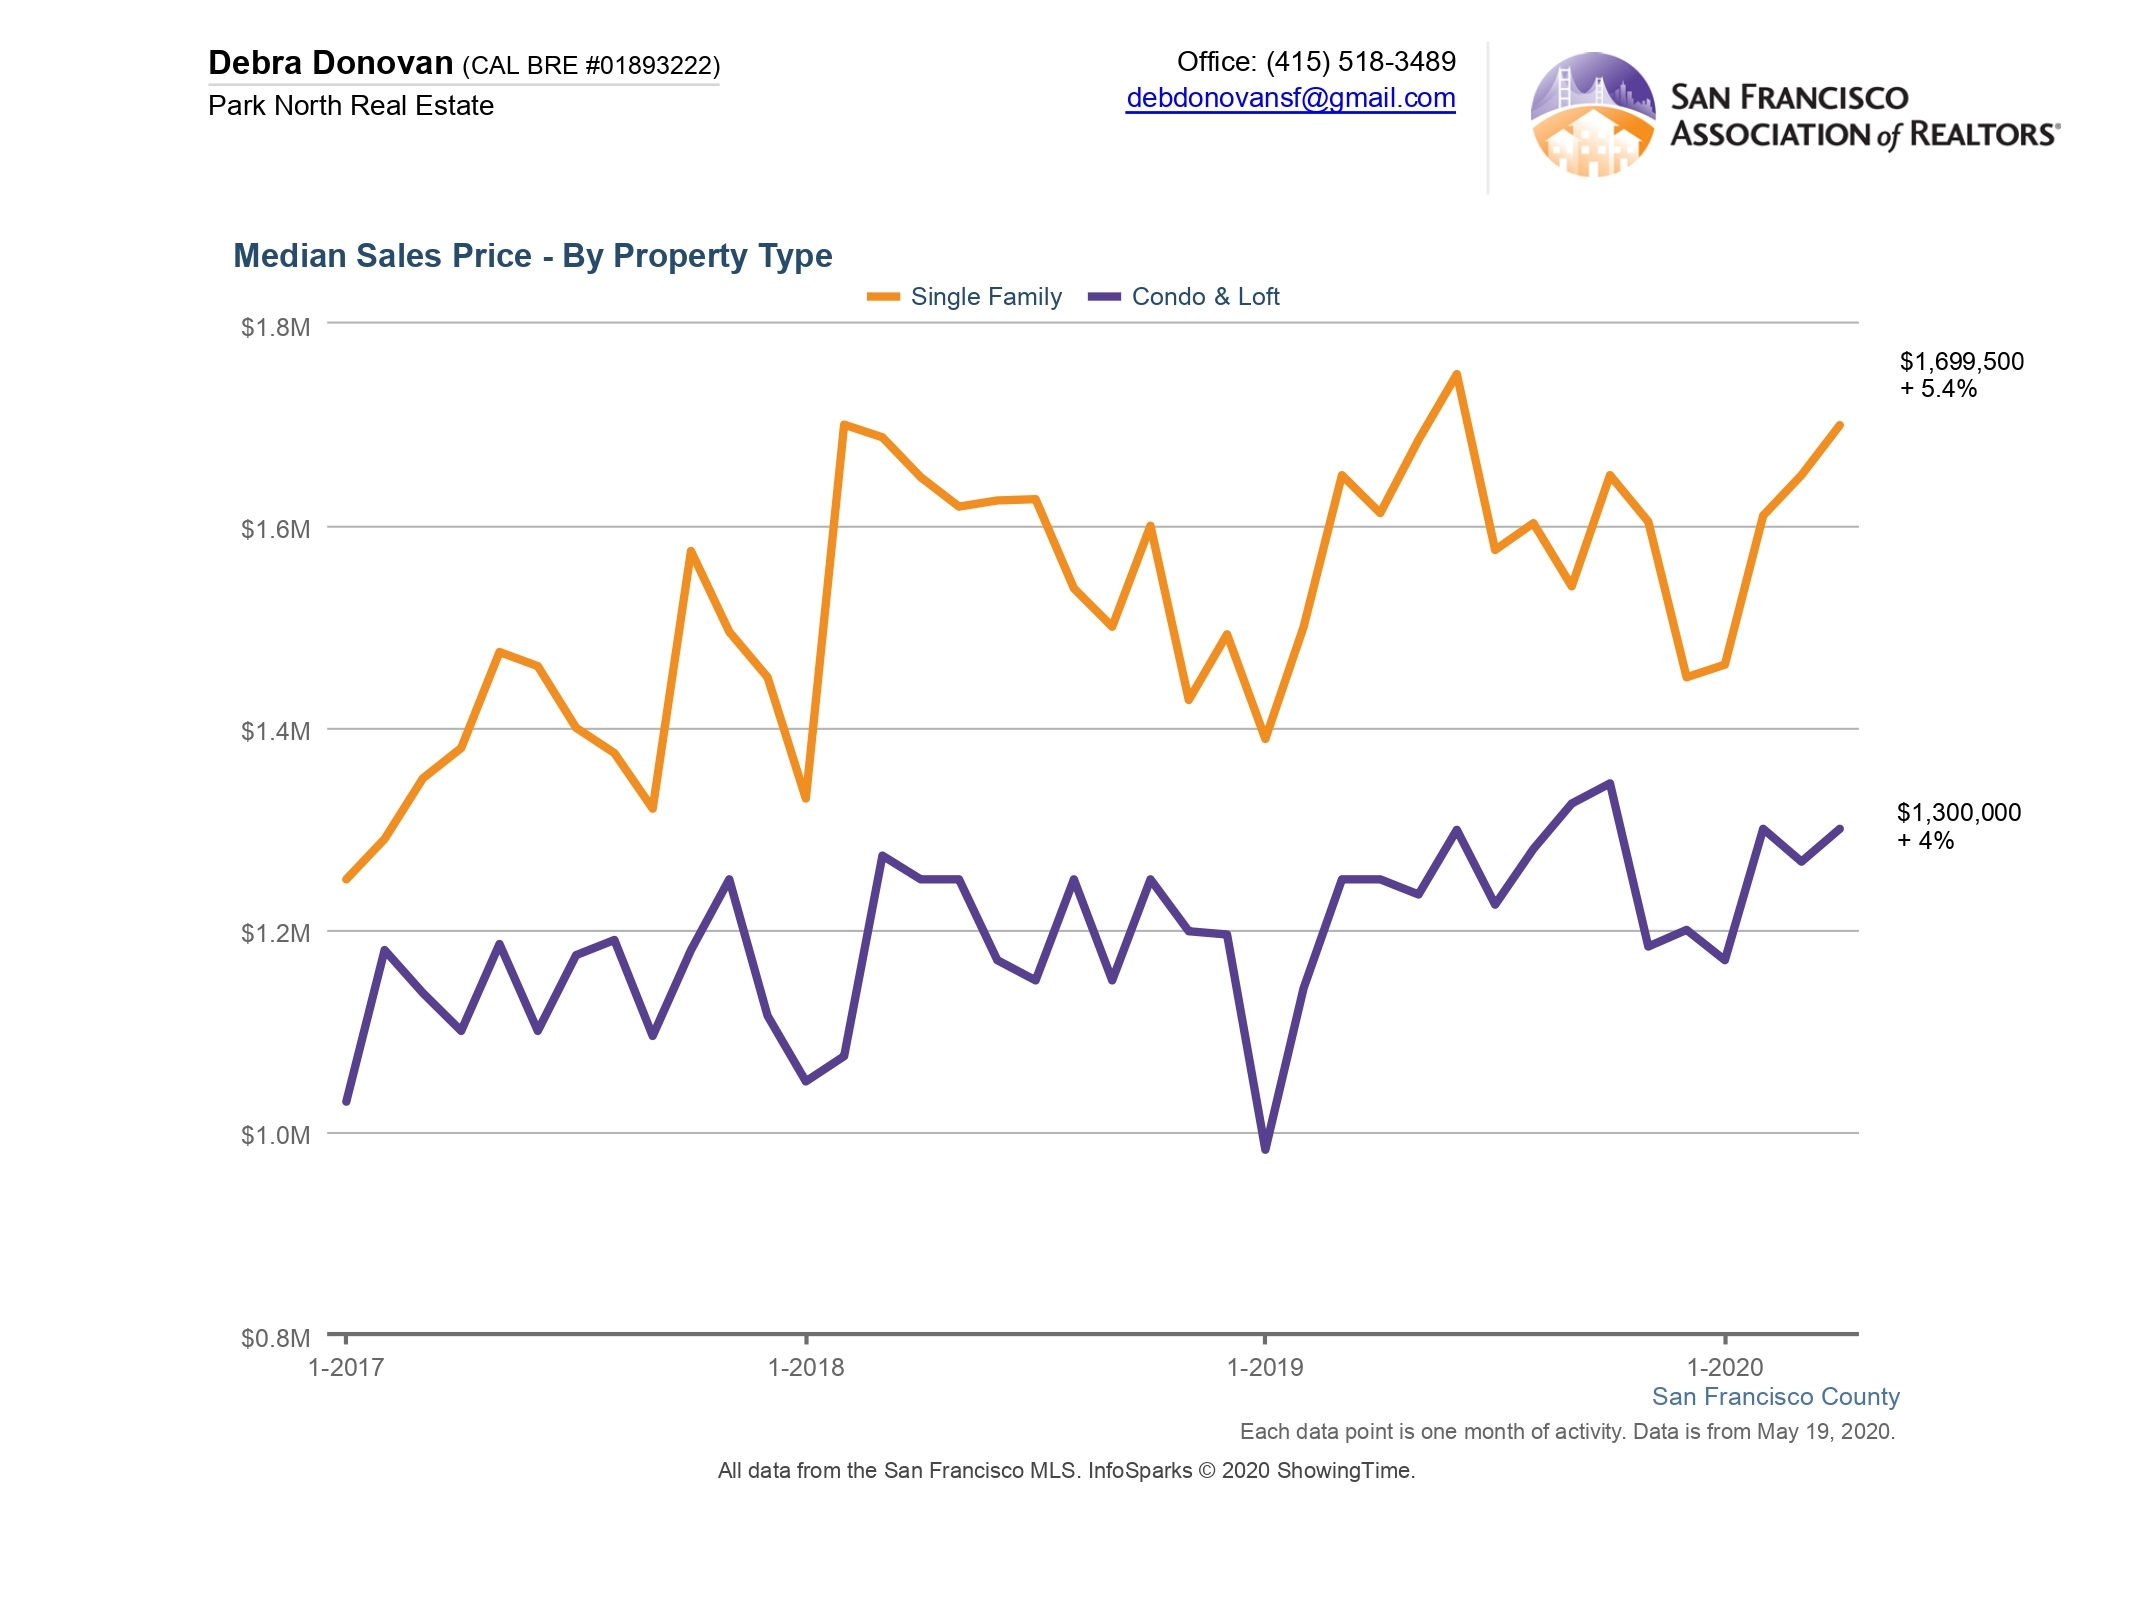
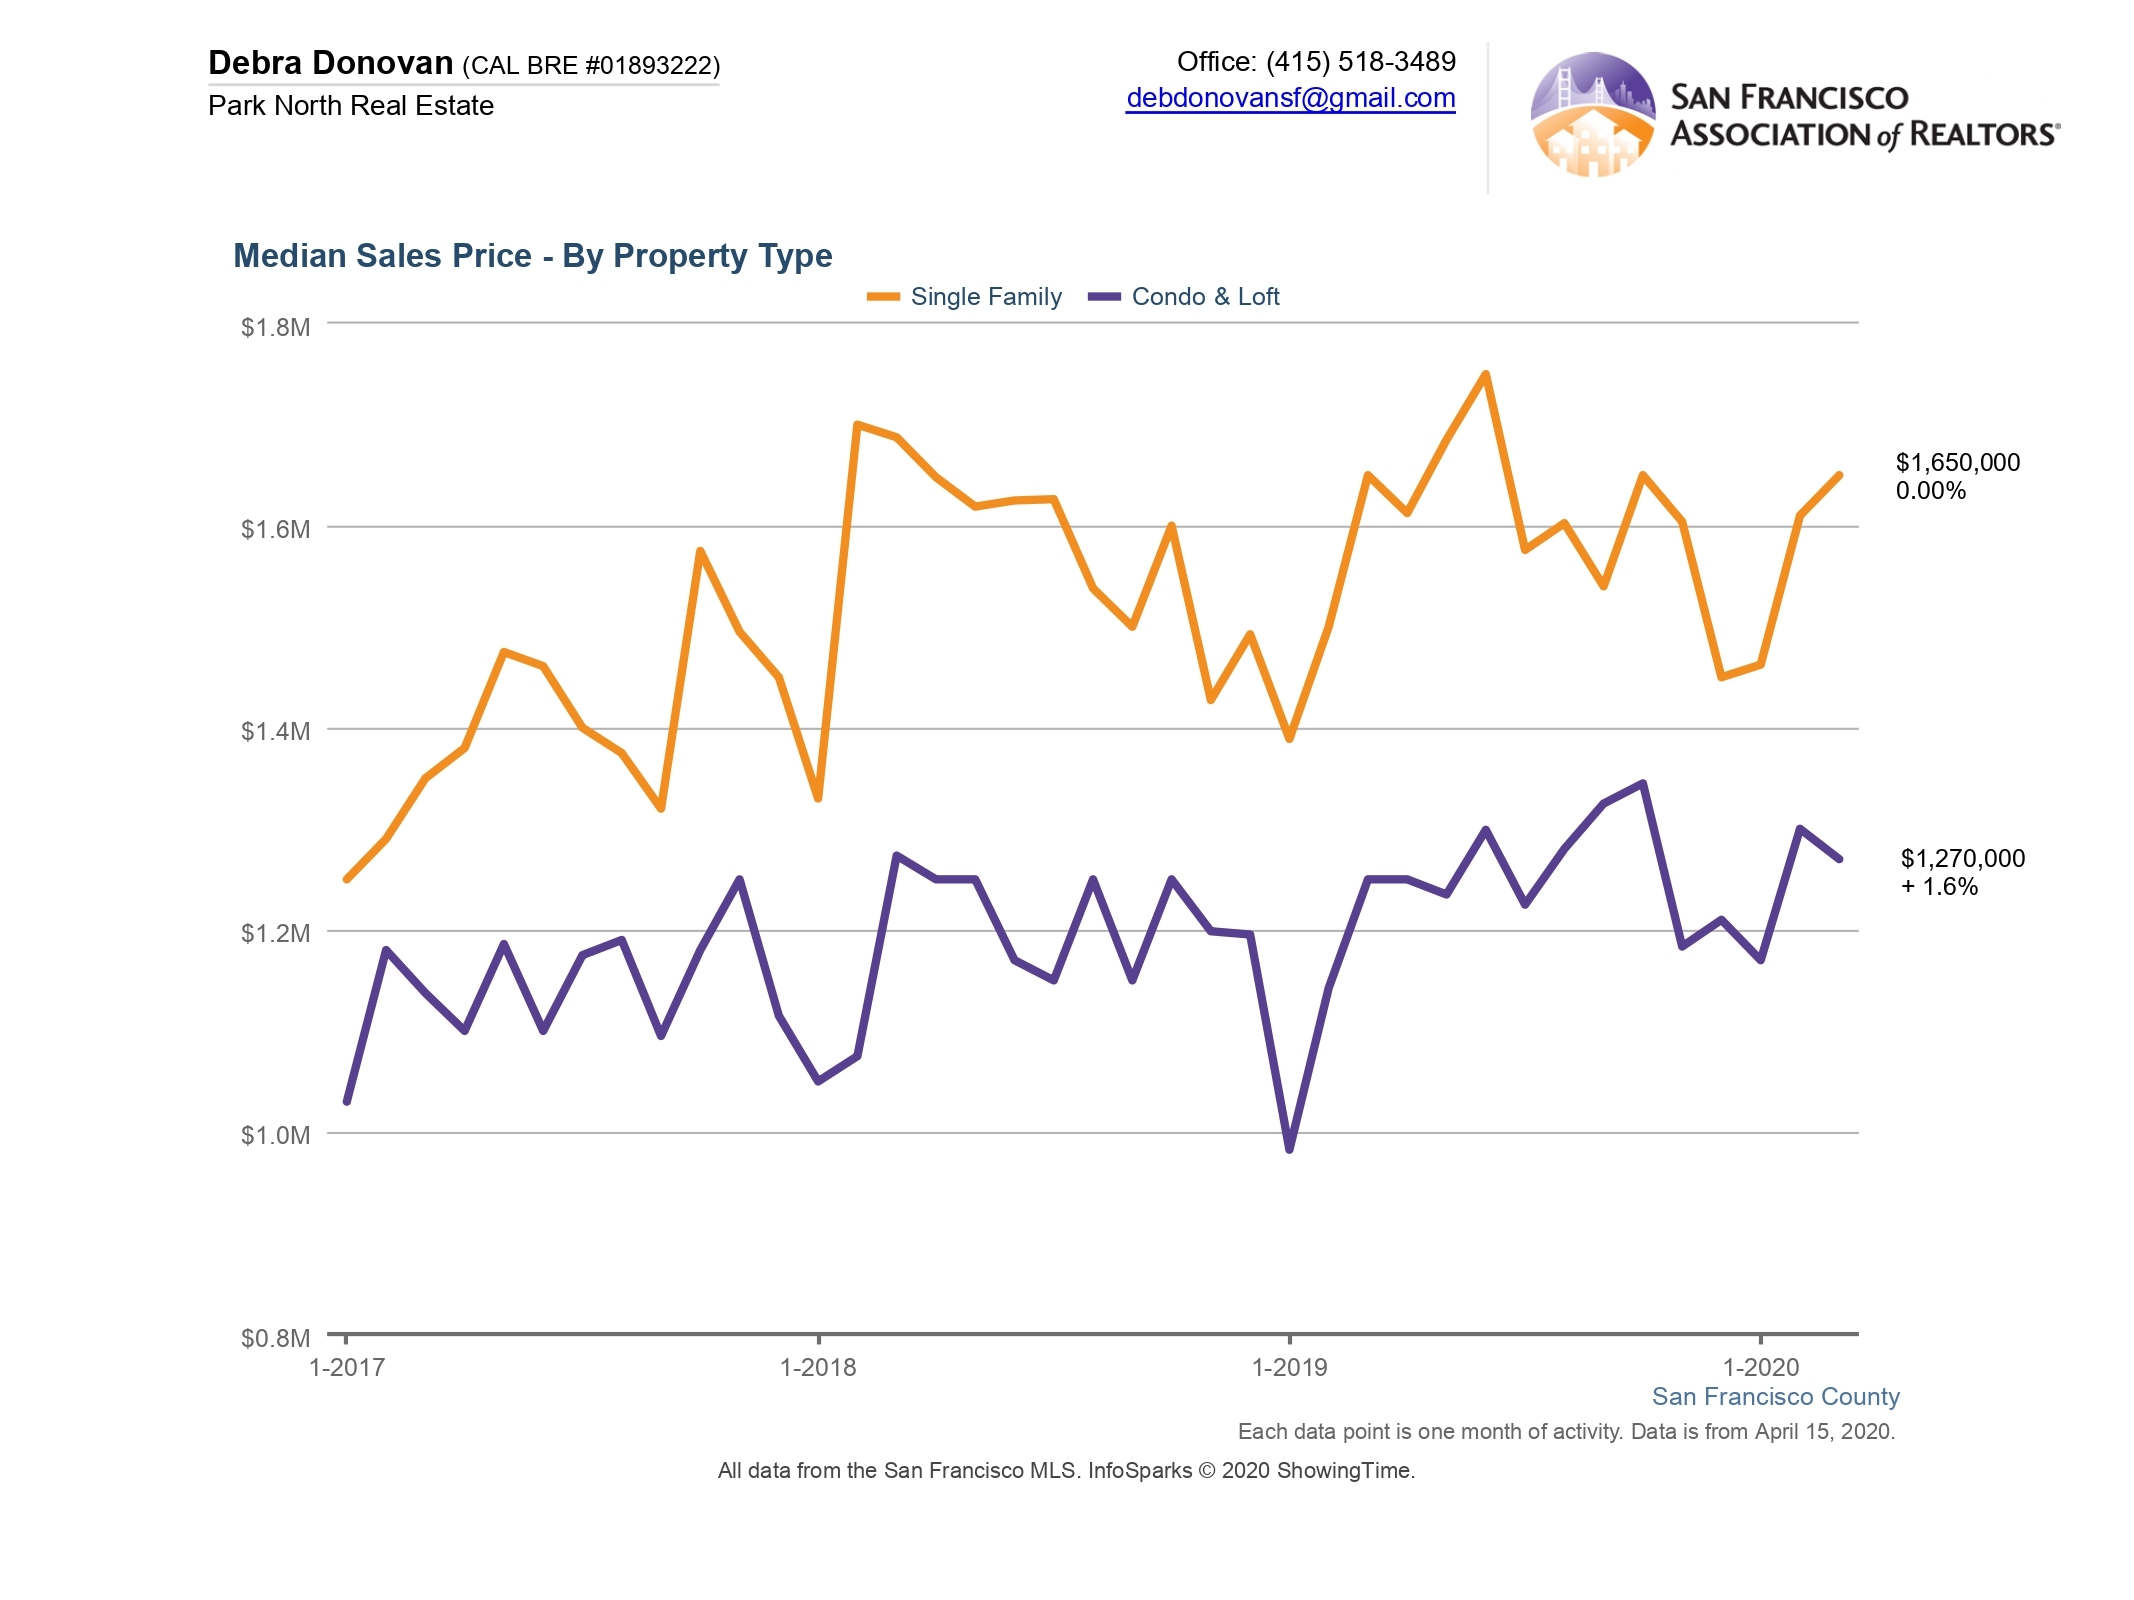
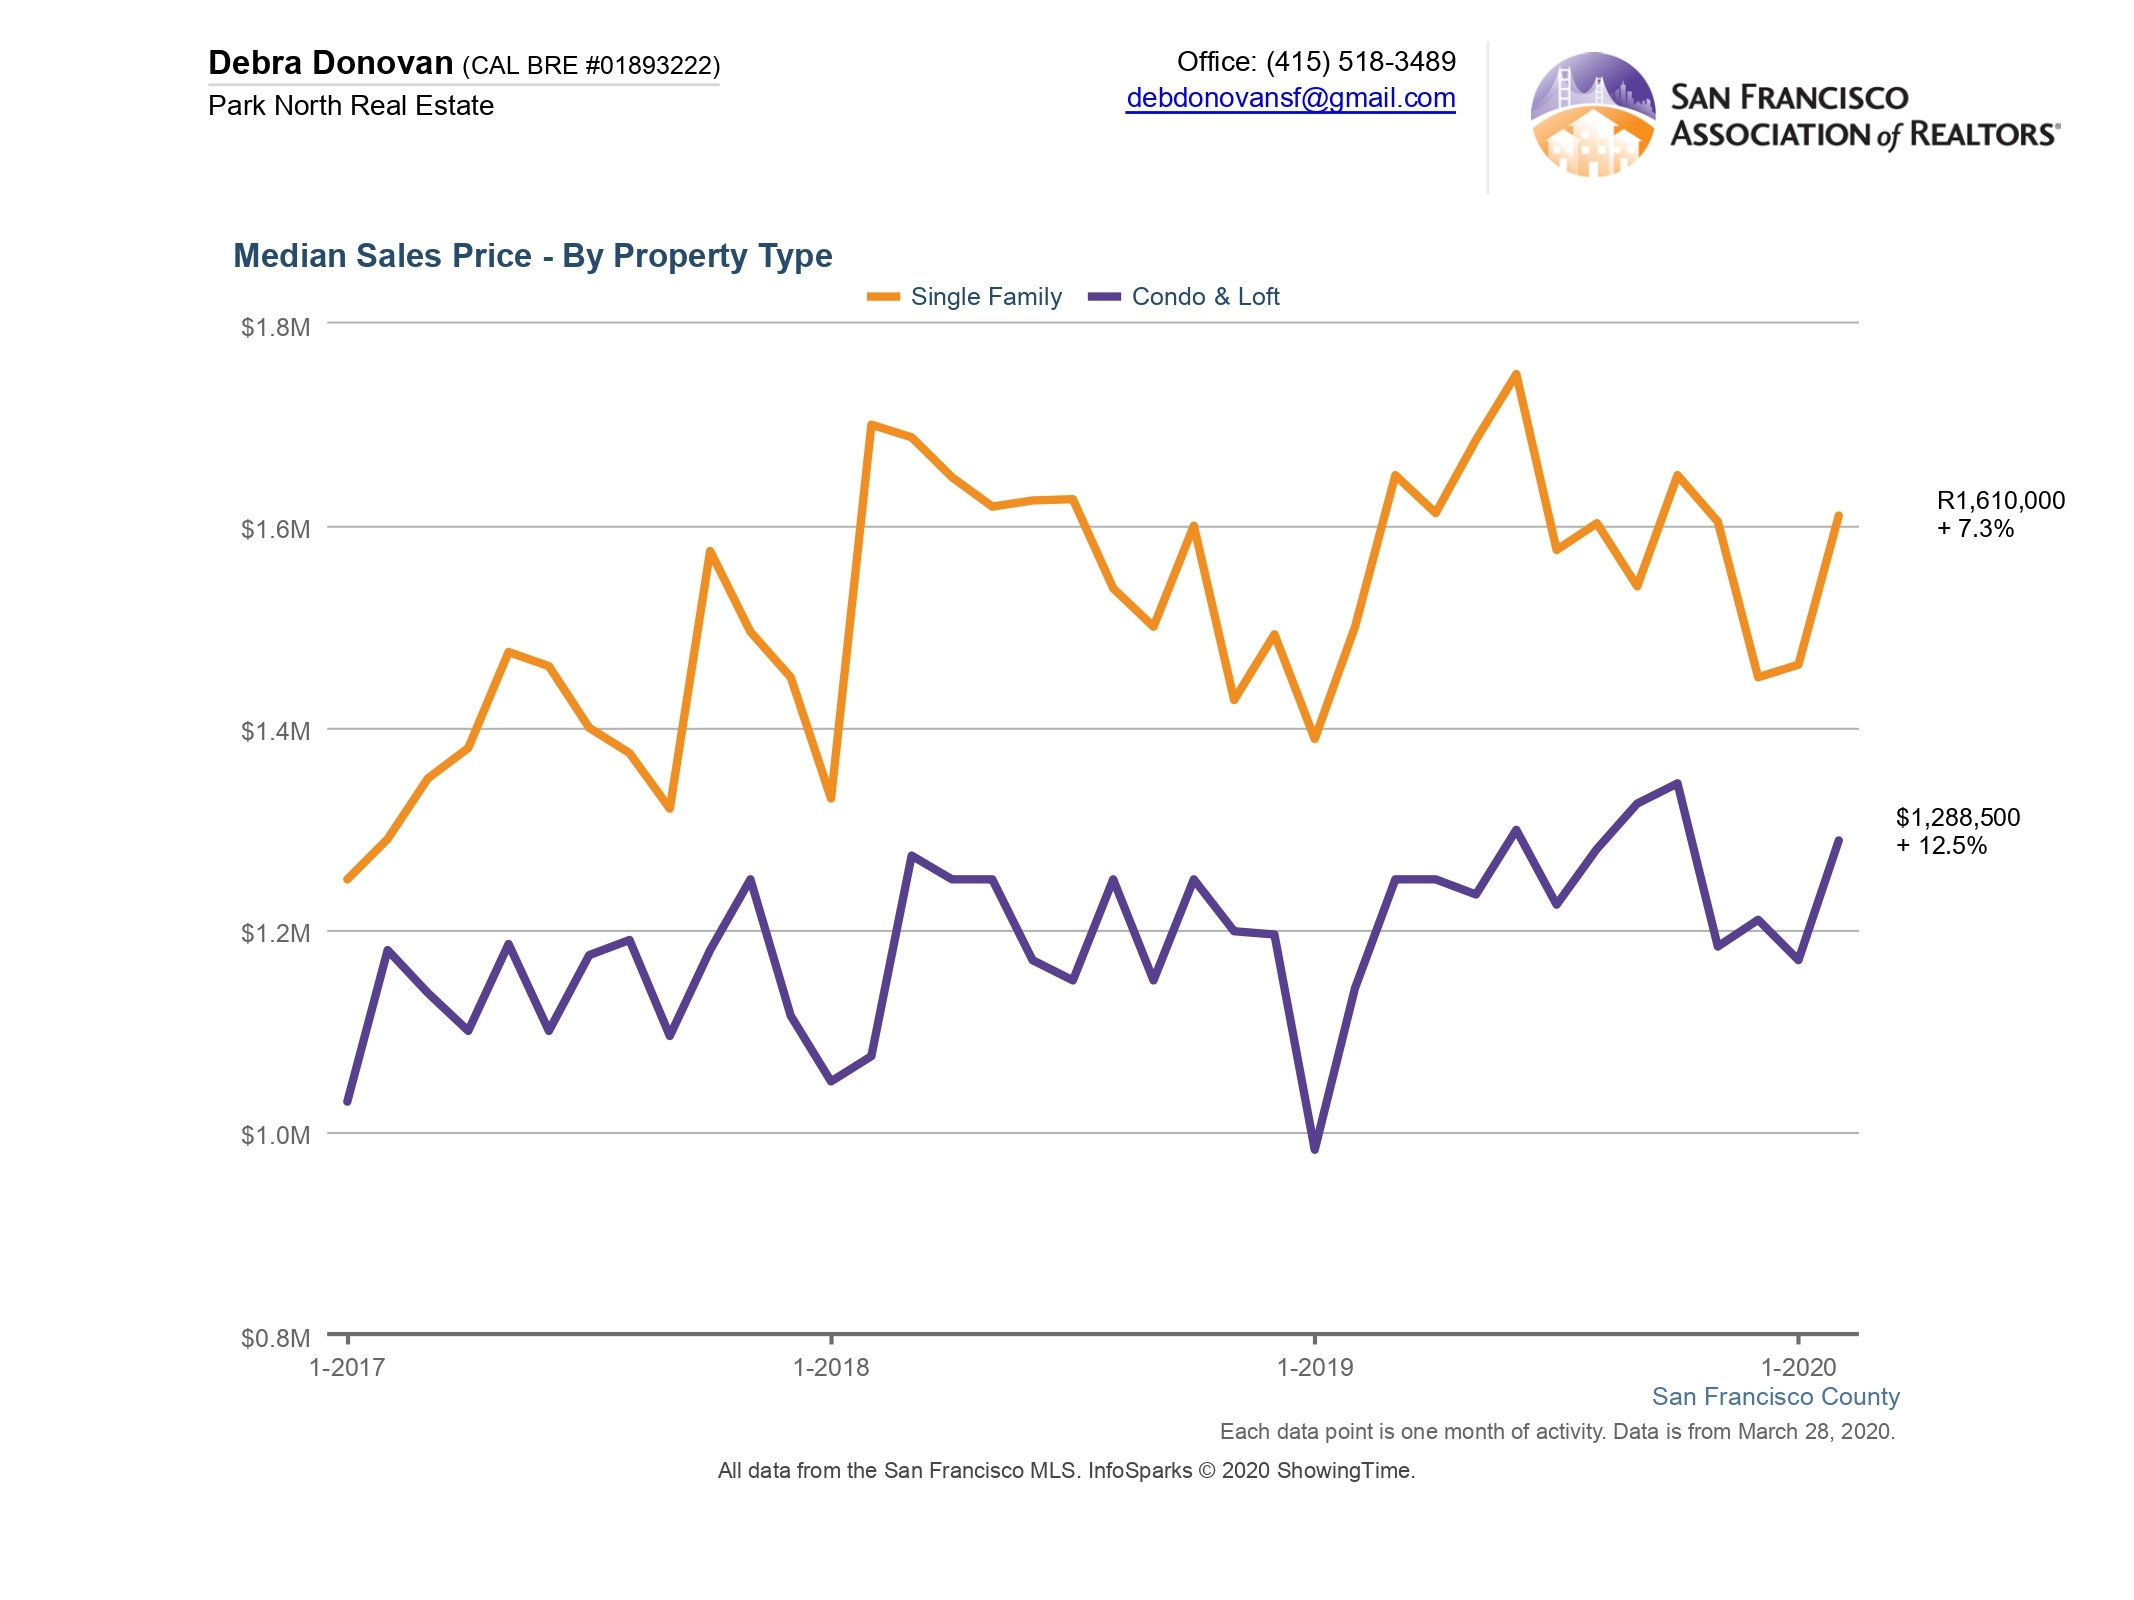
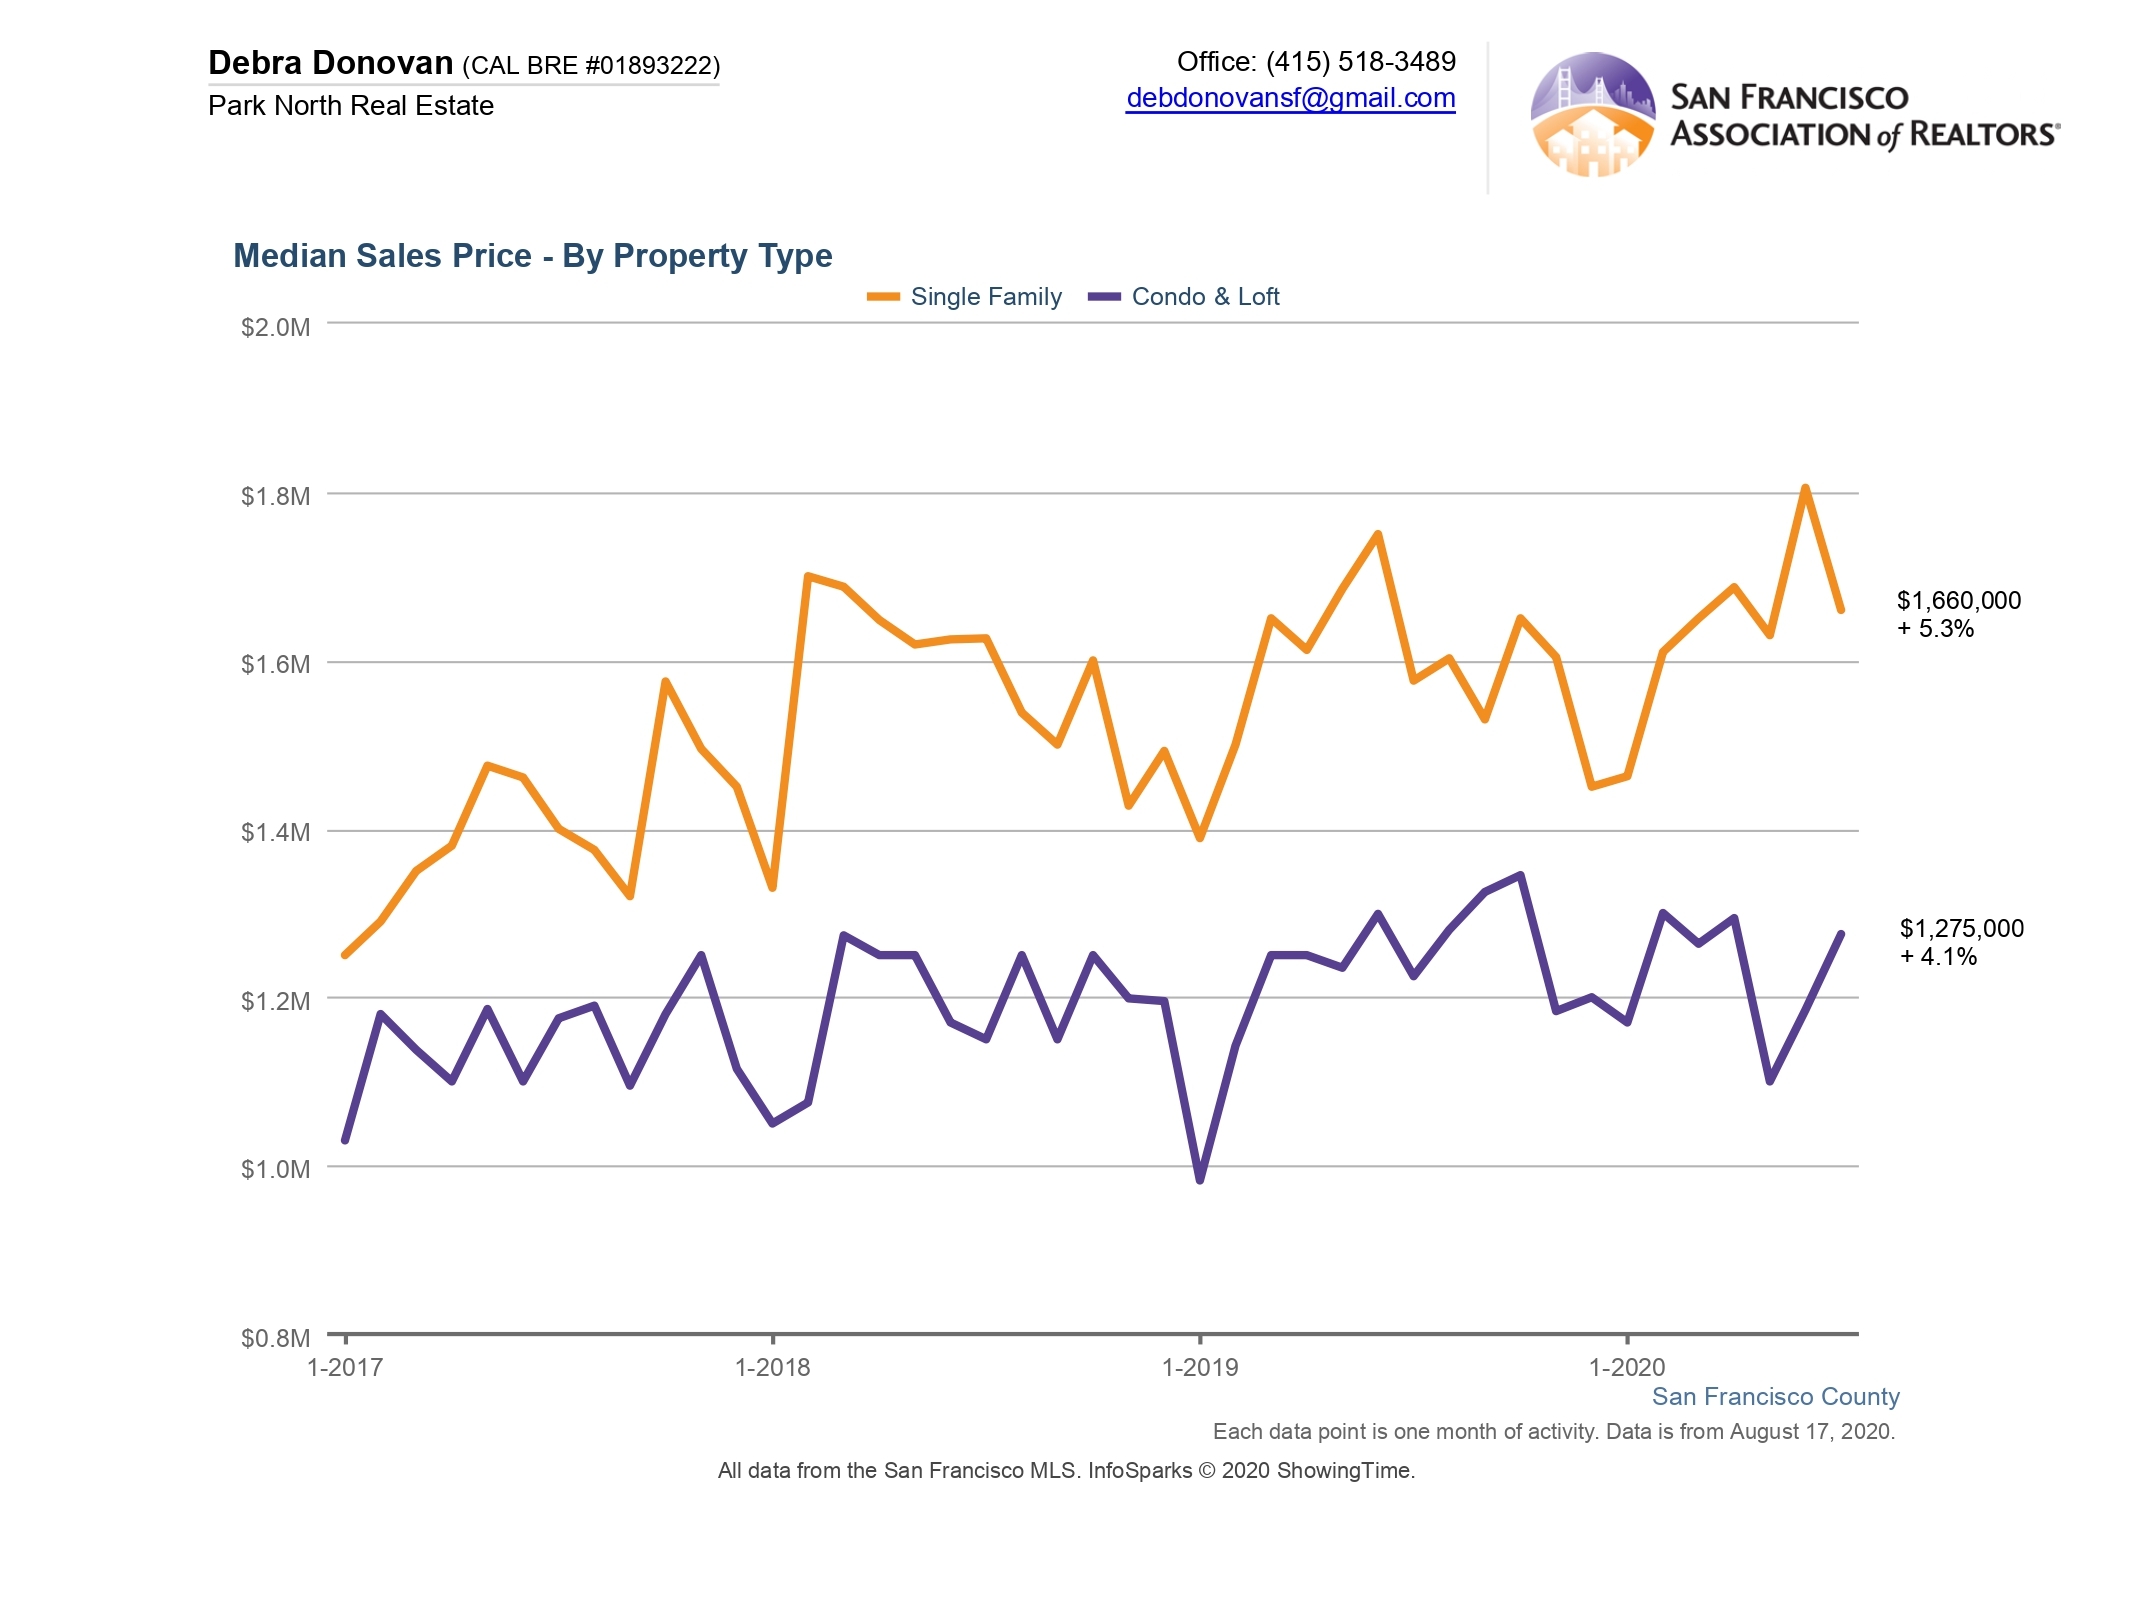
Median Sales Price:
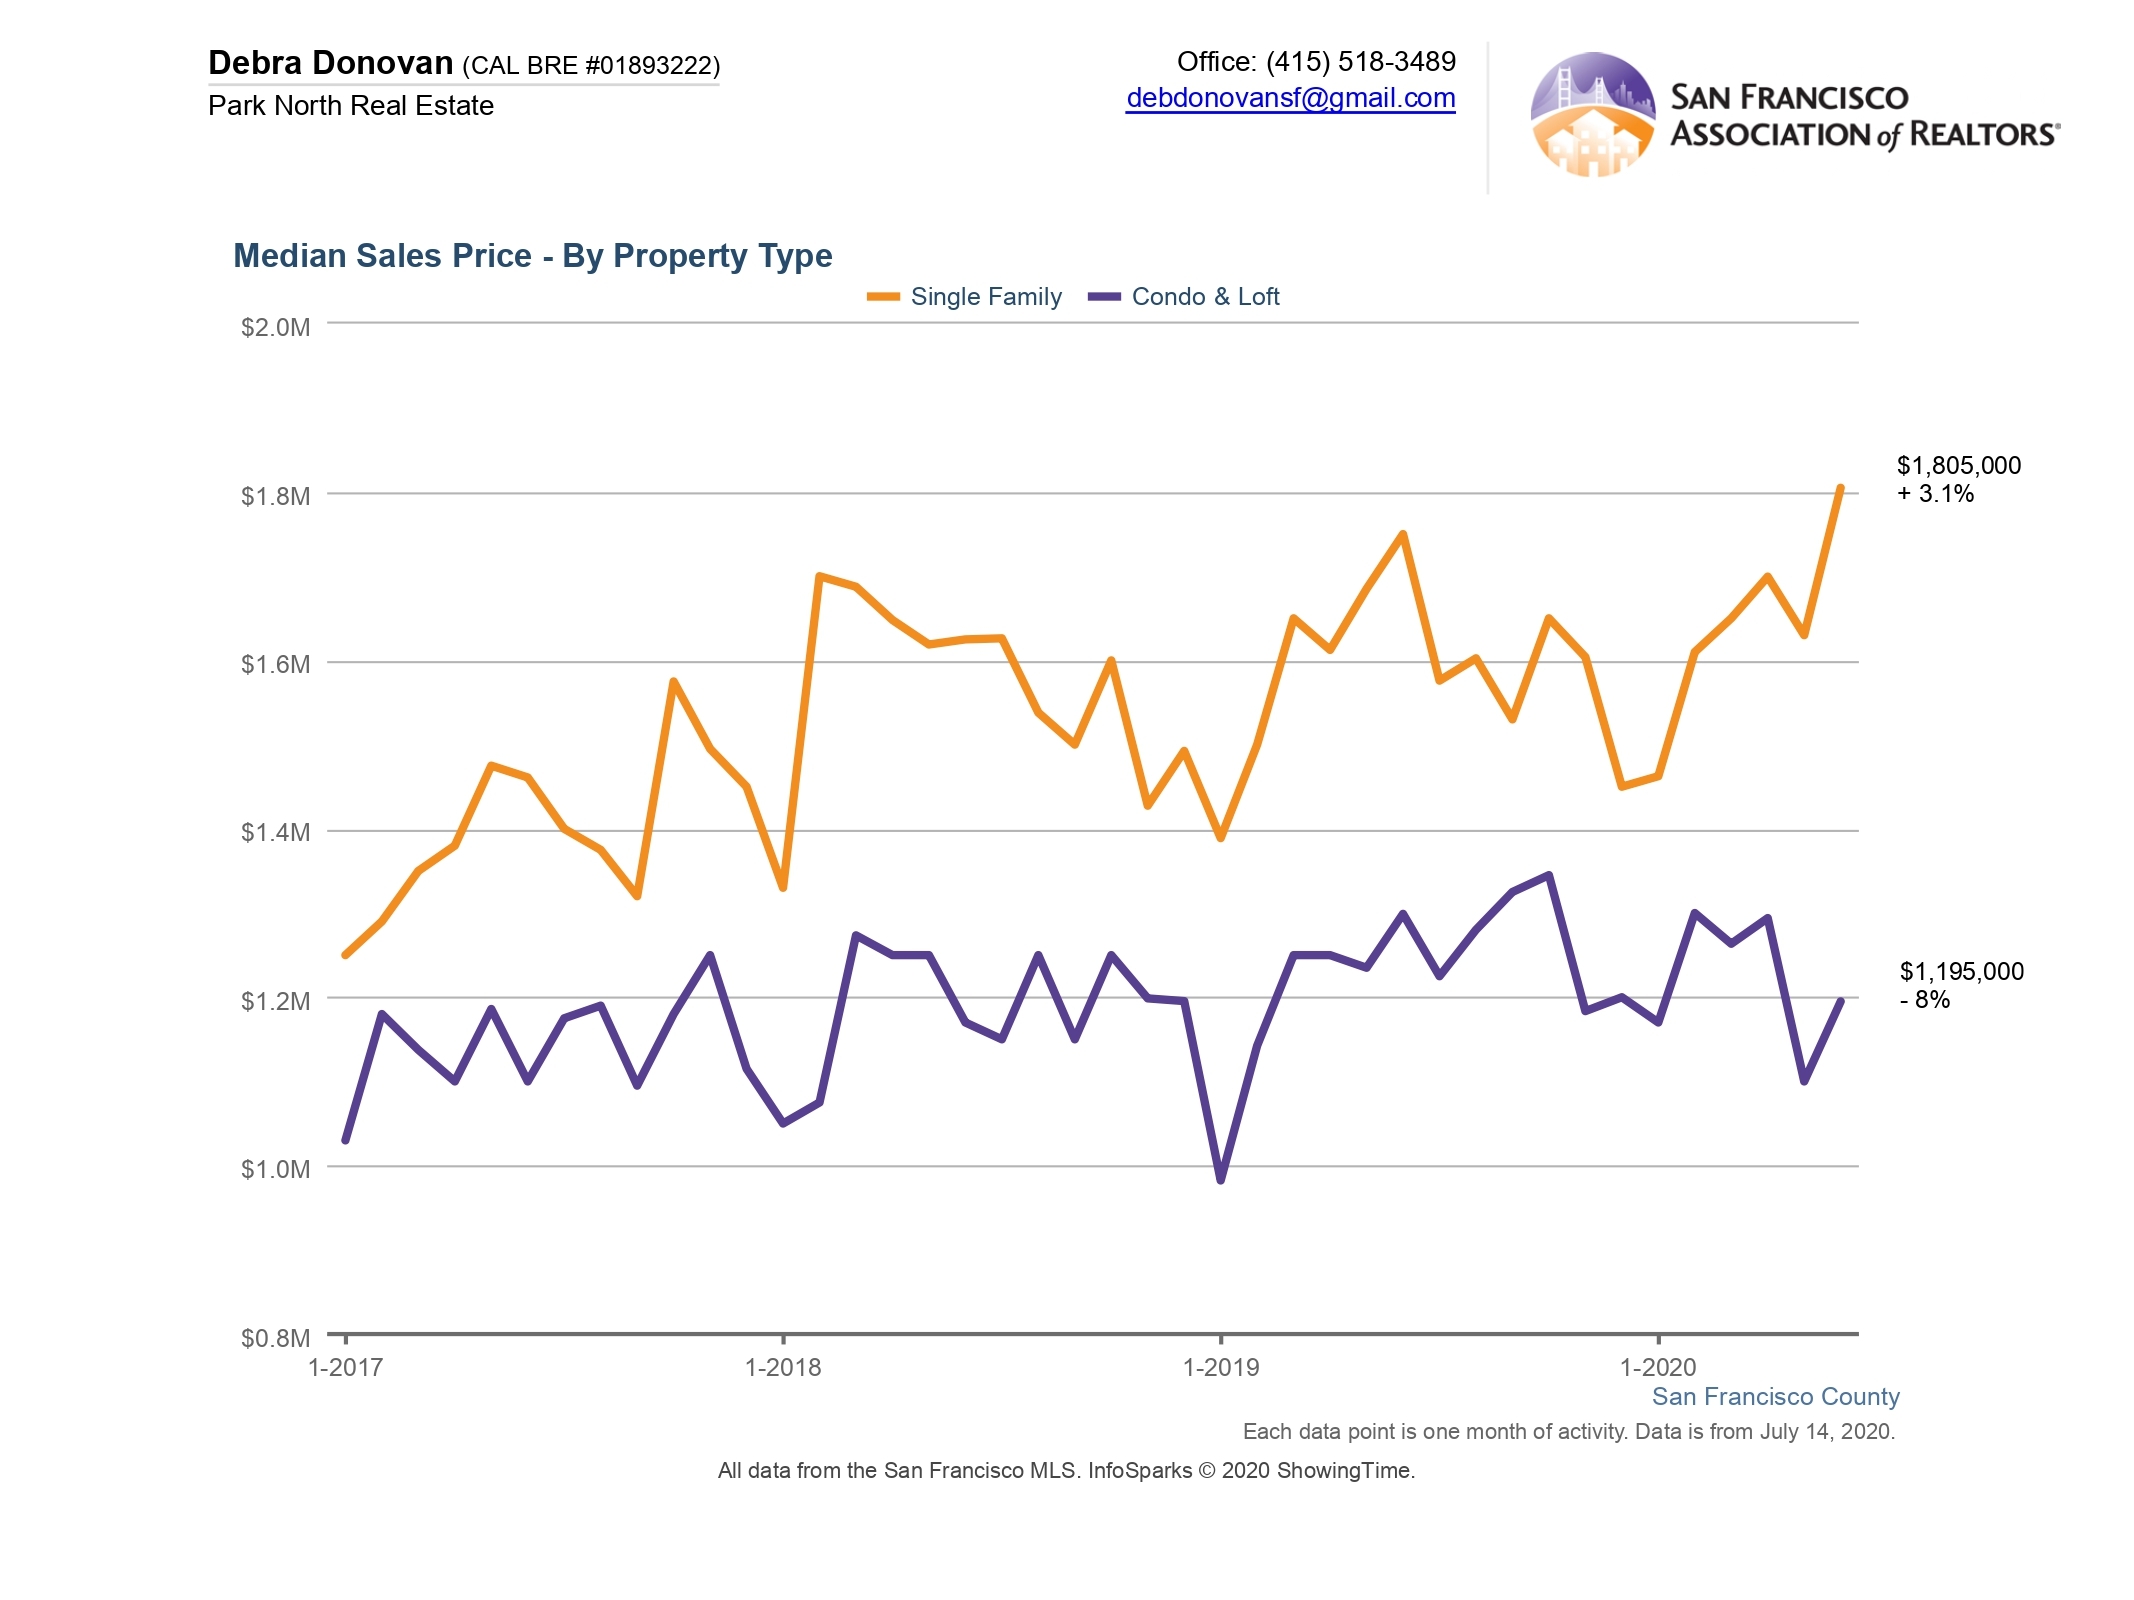
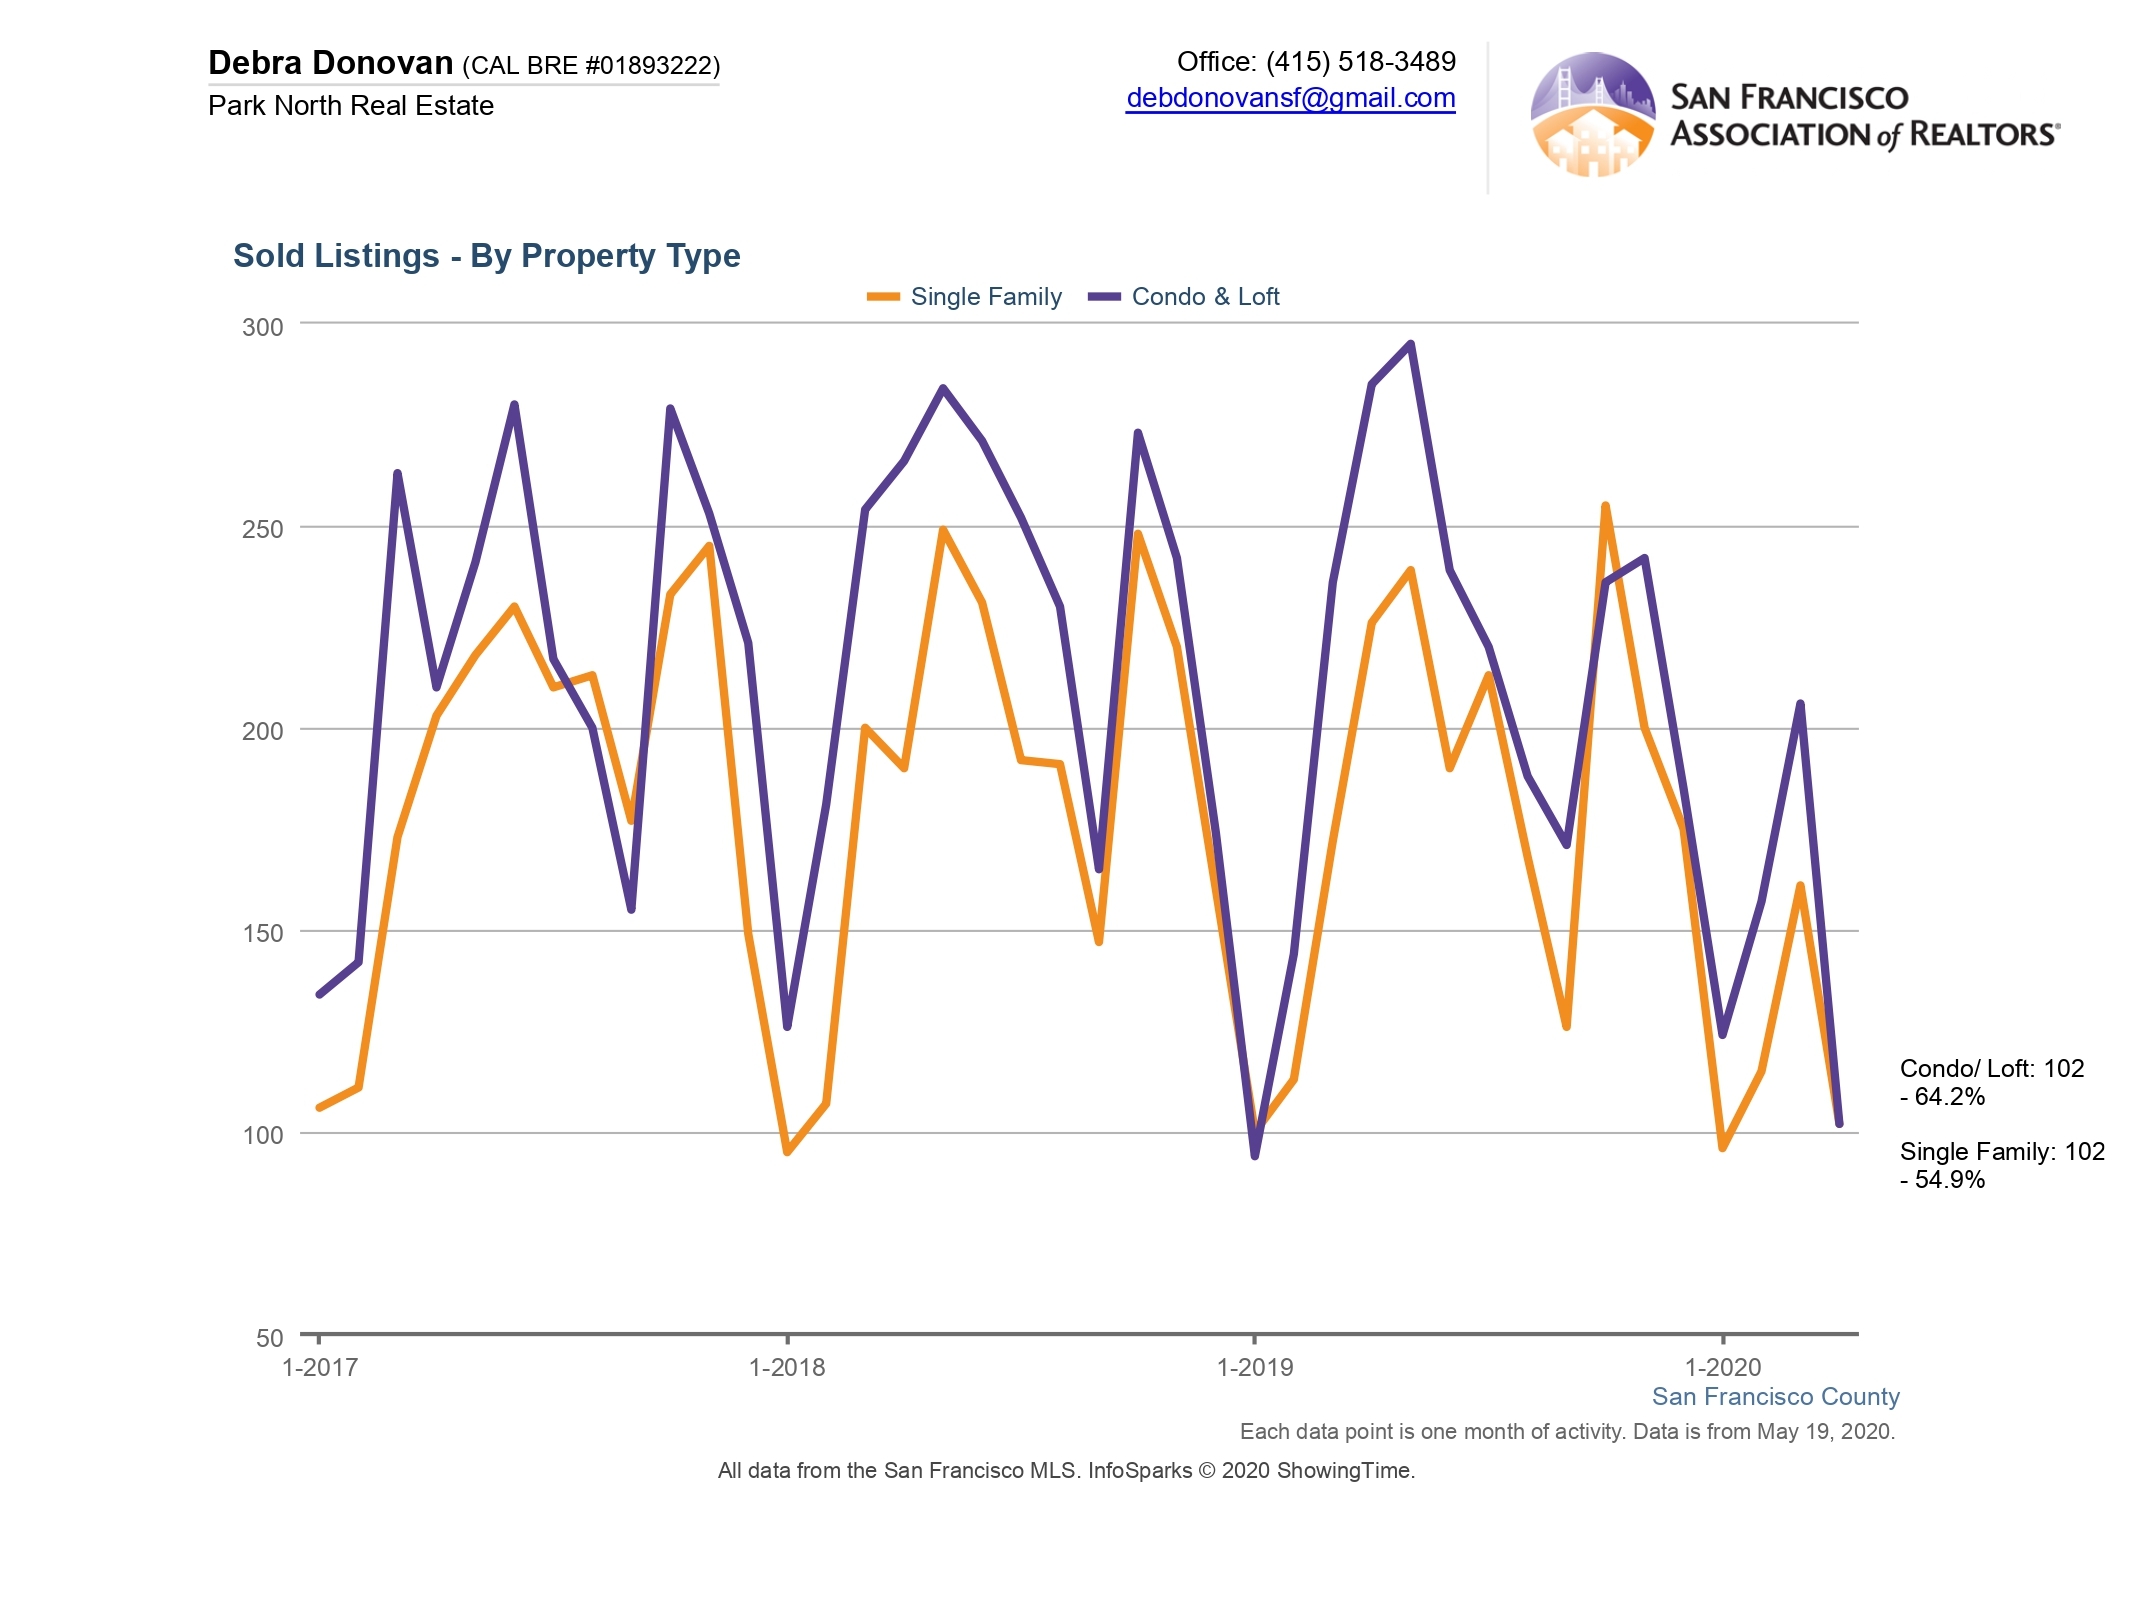
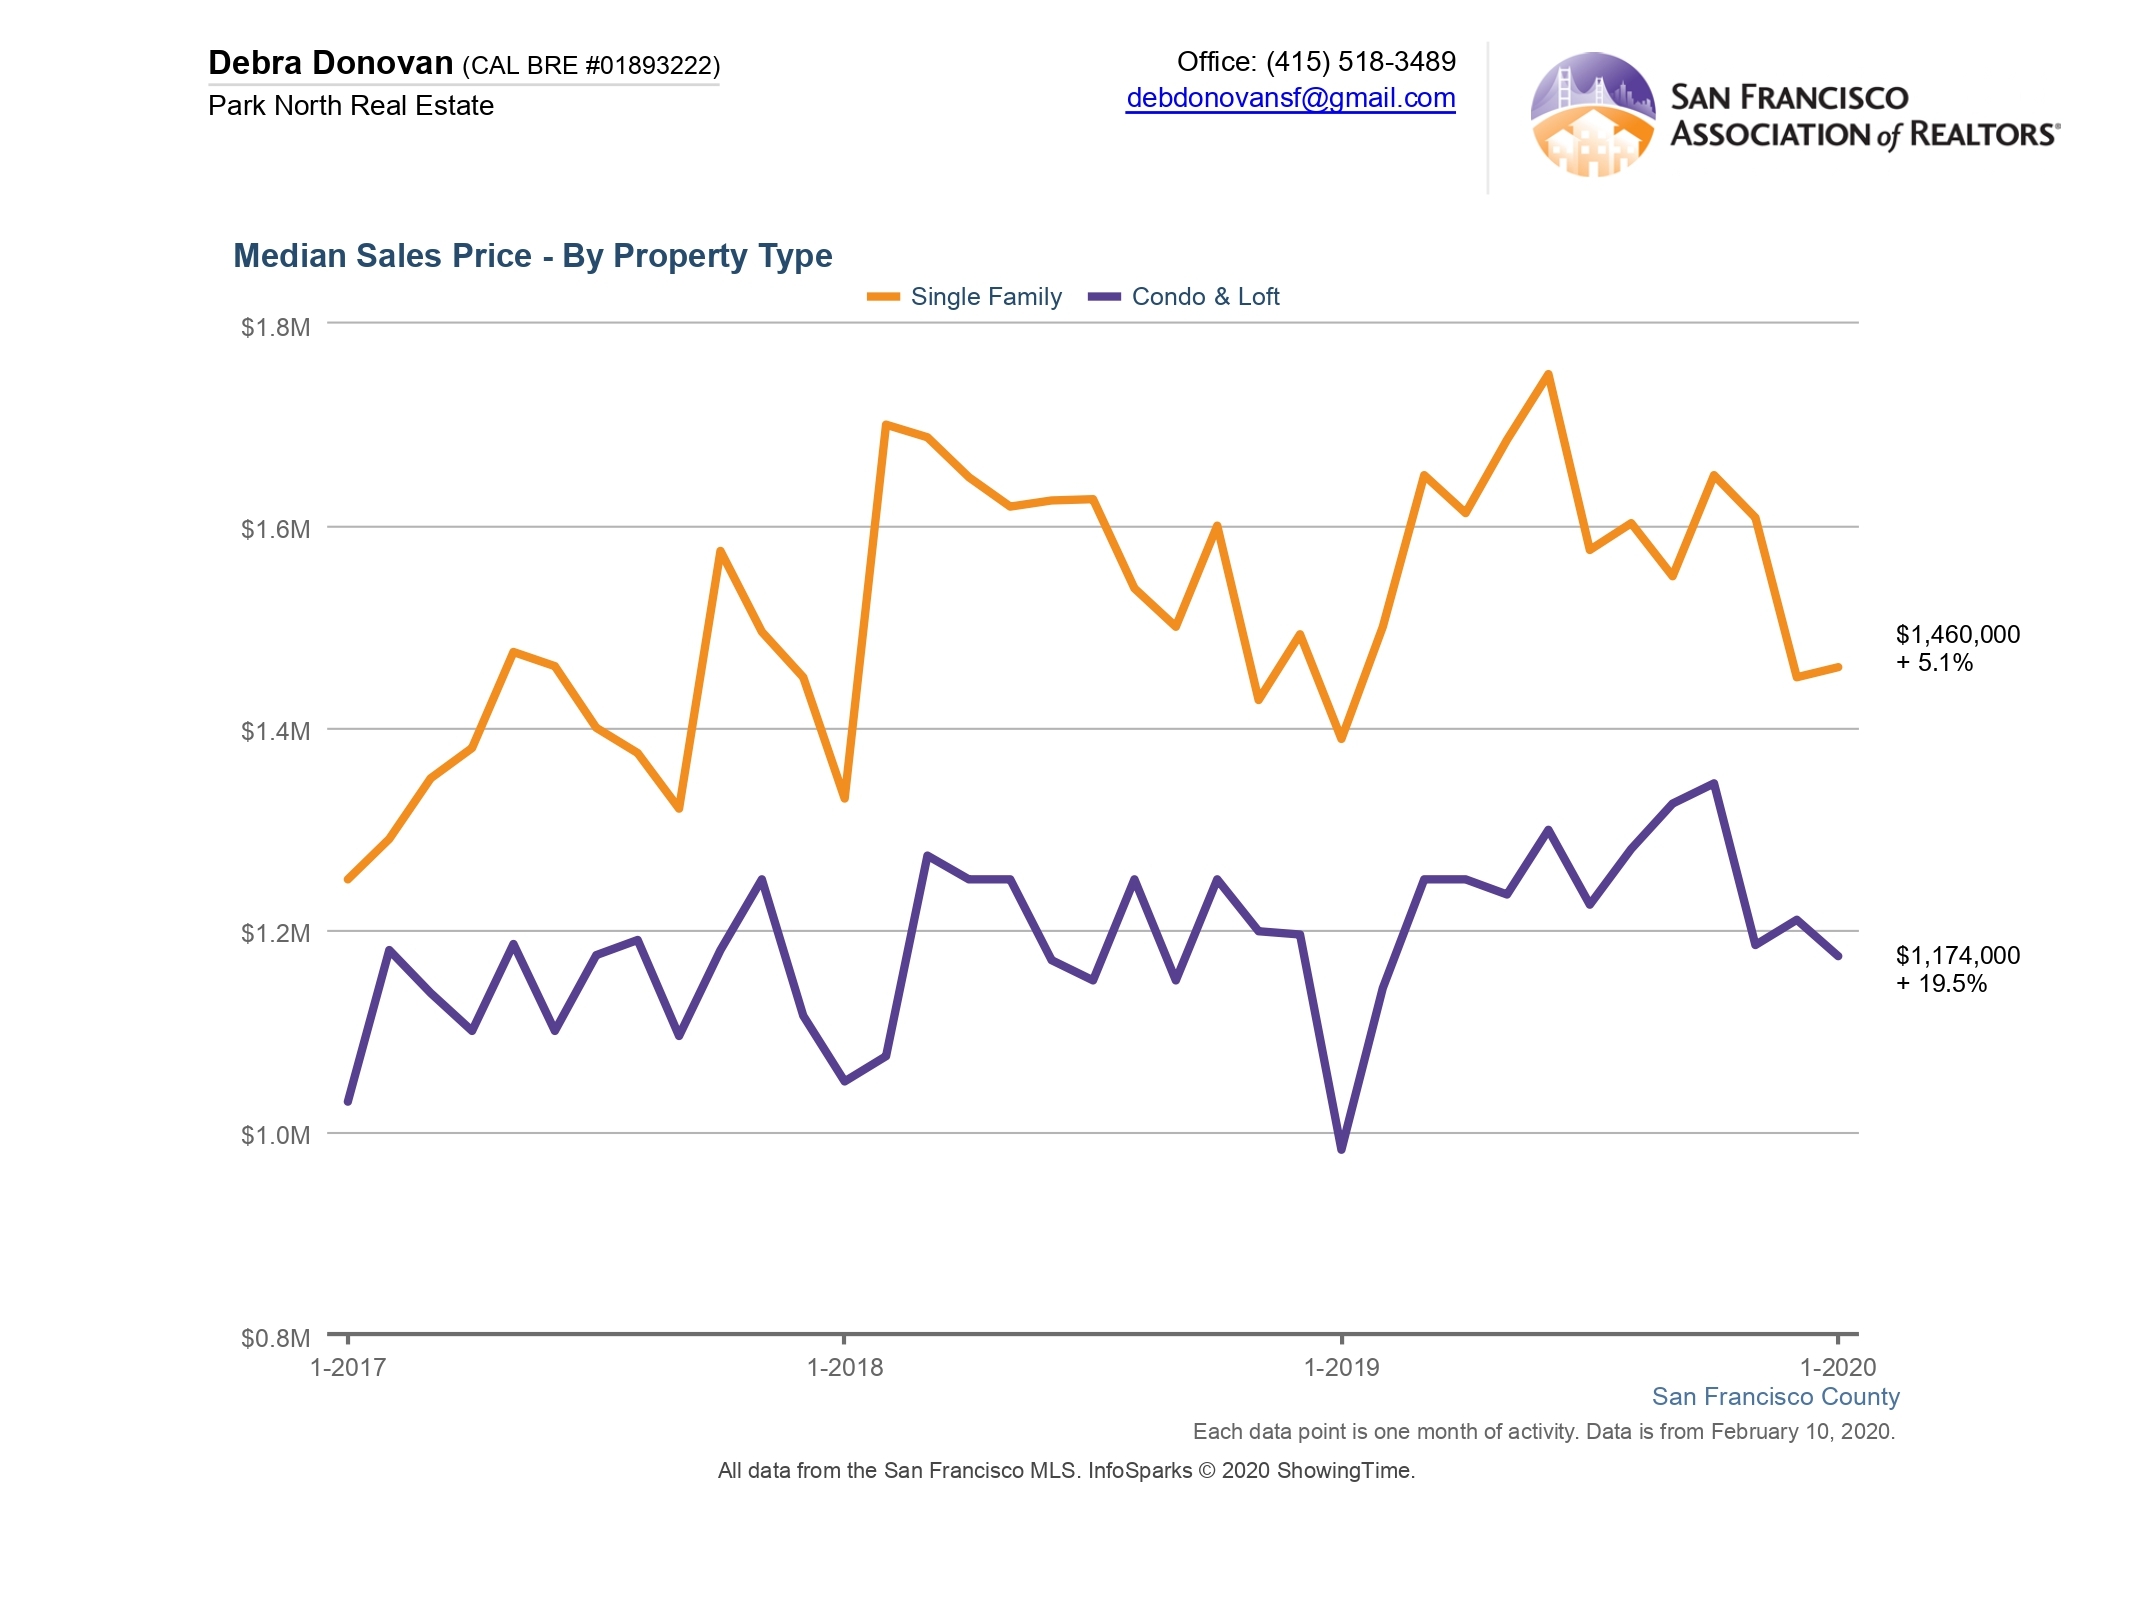
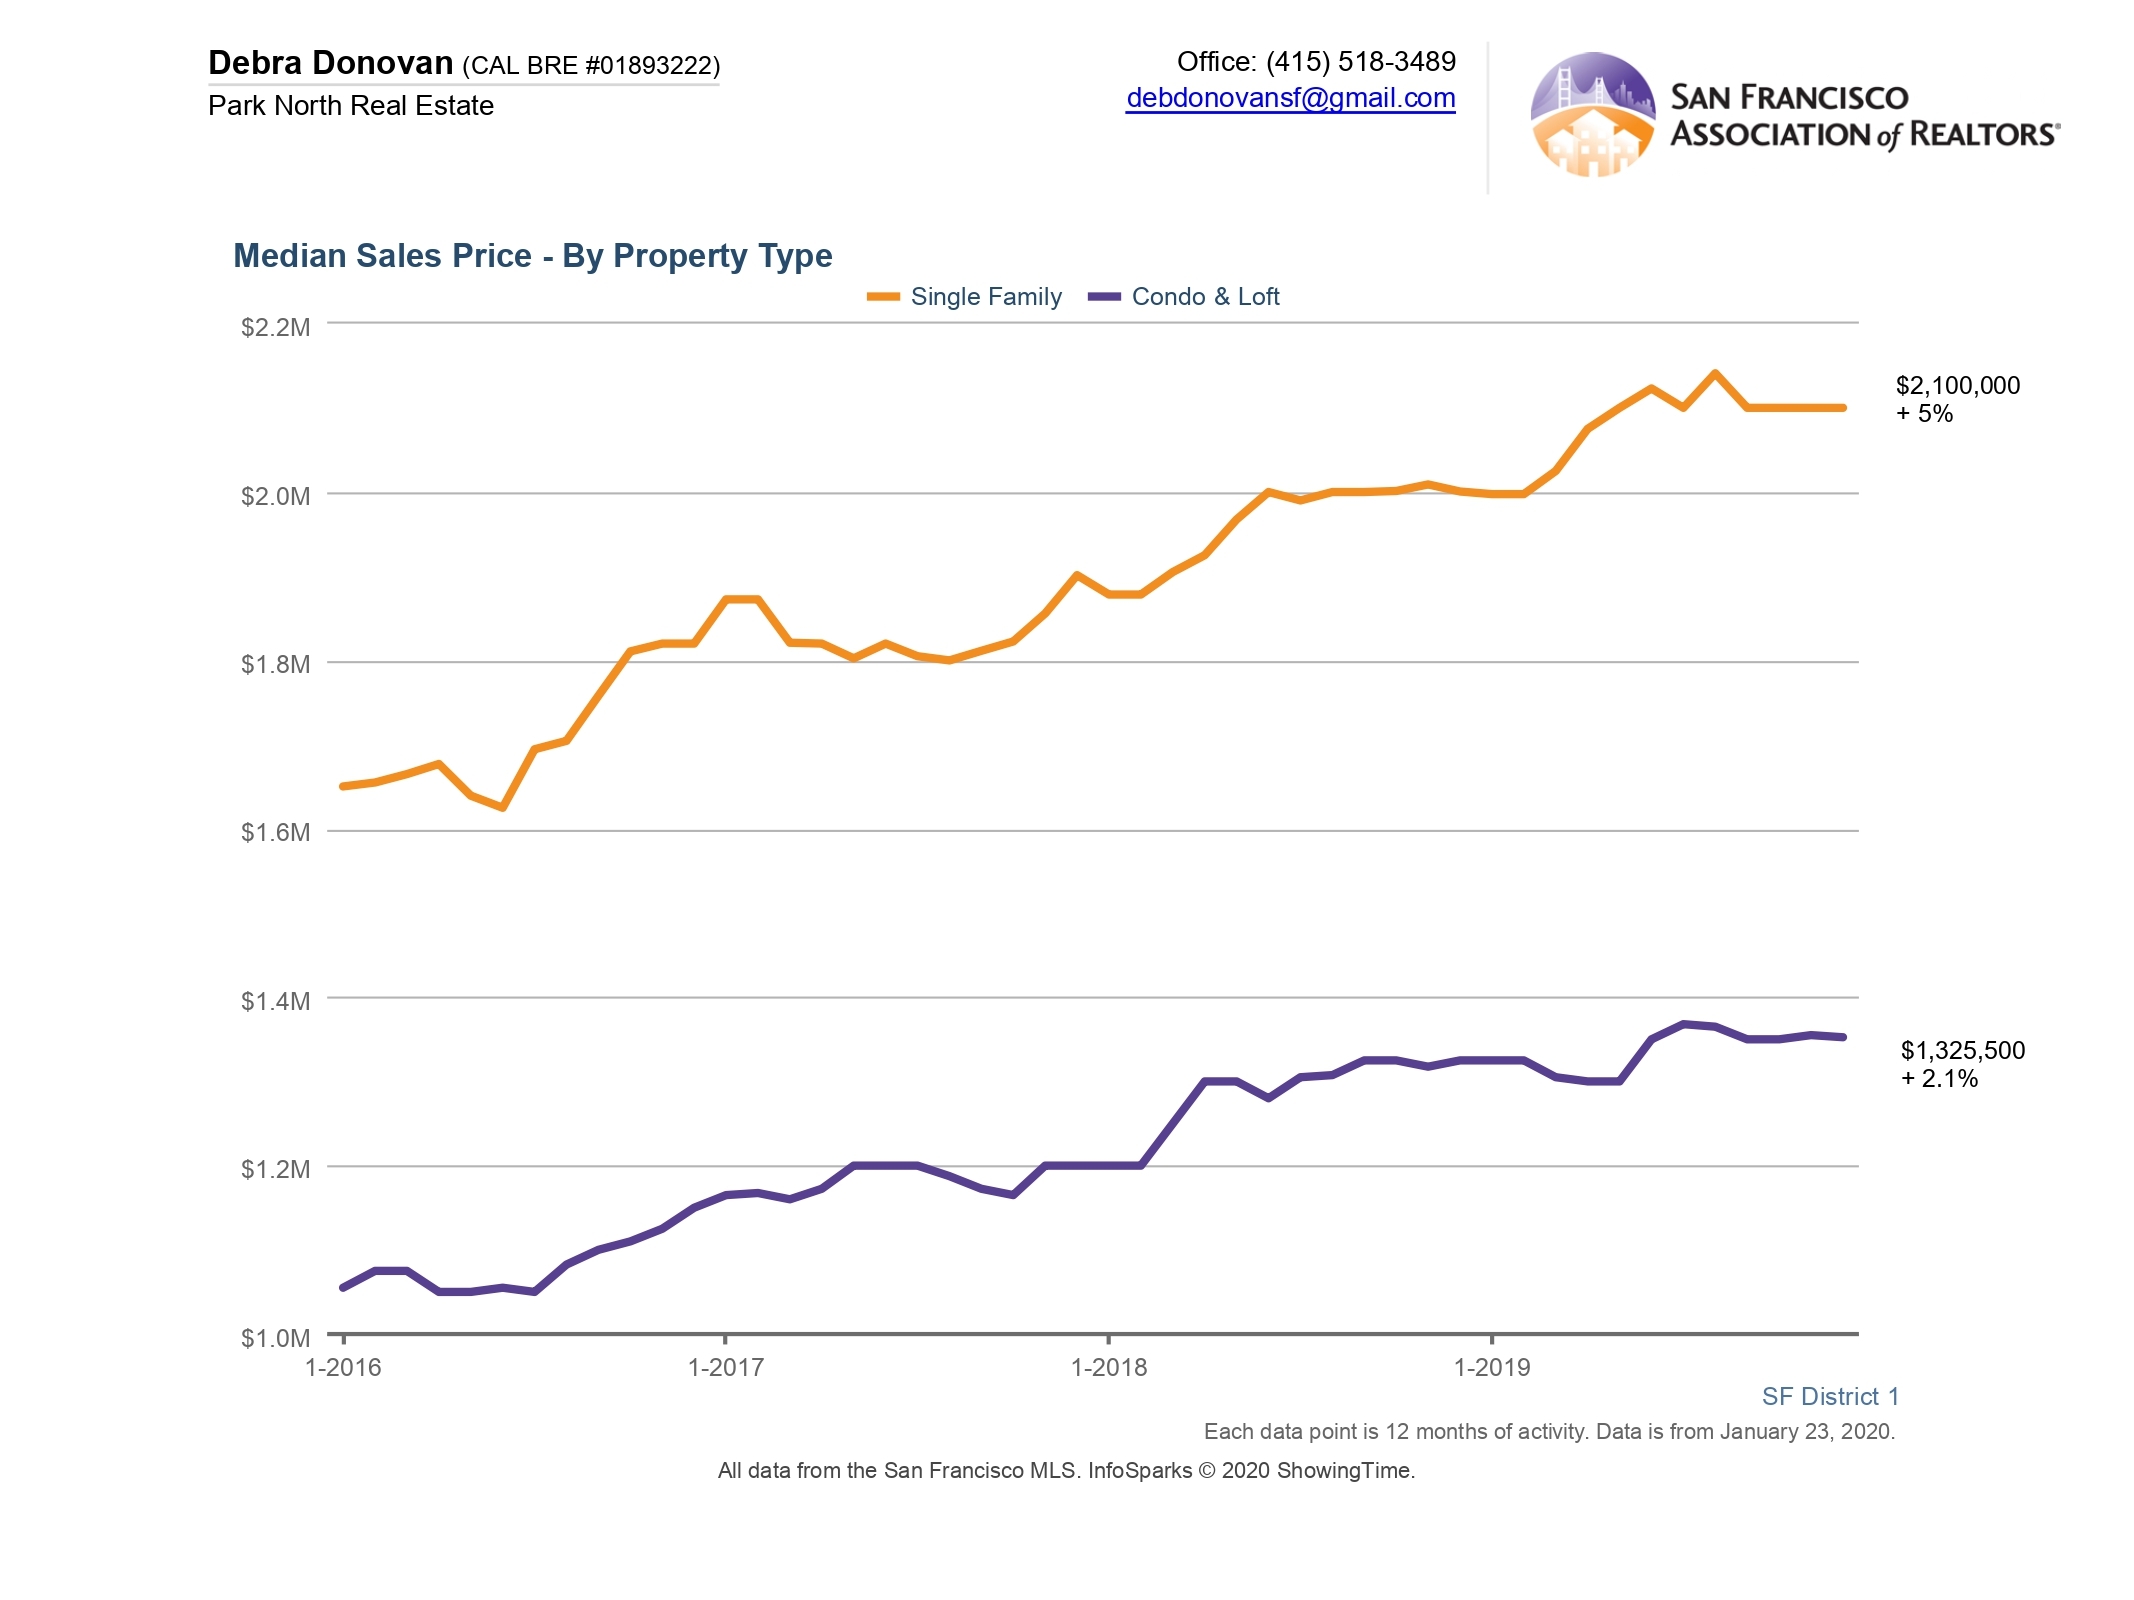
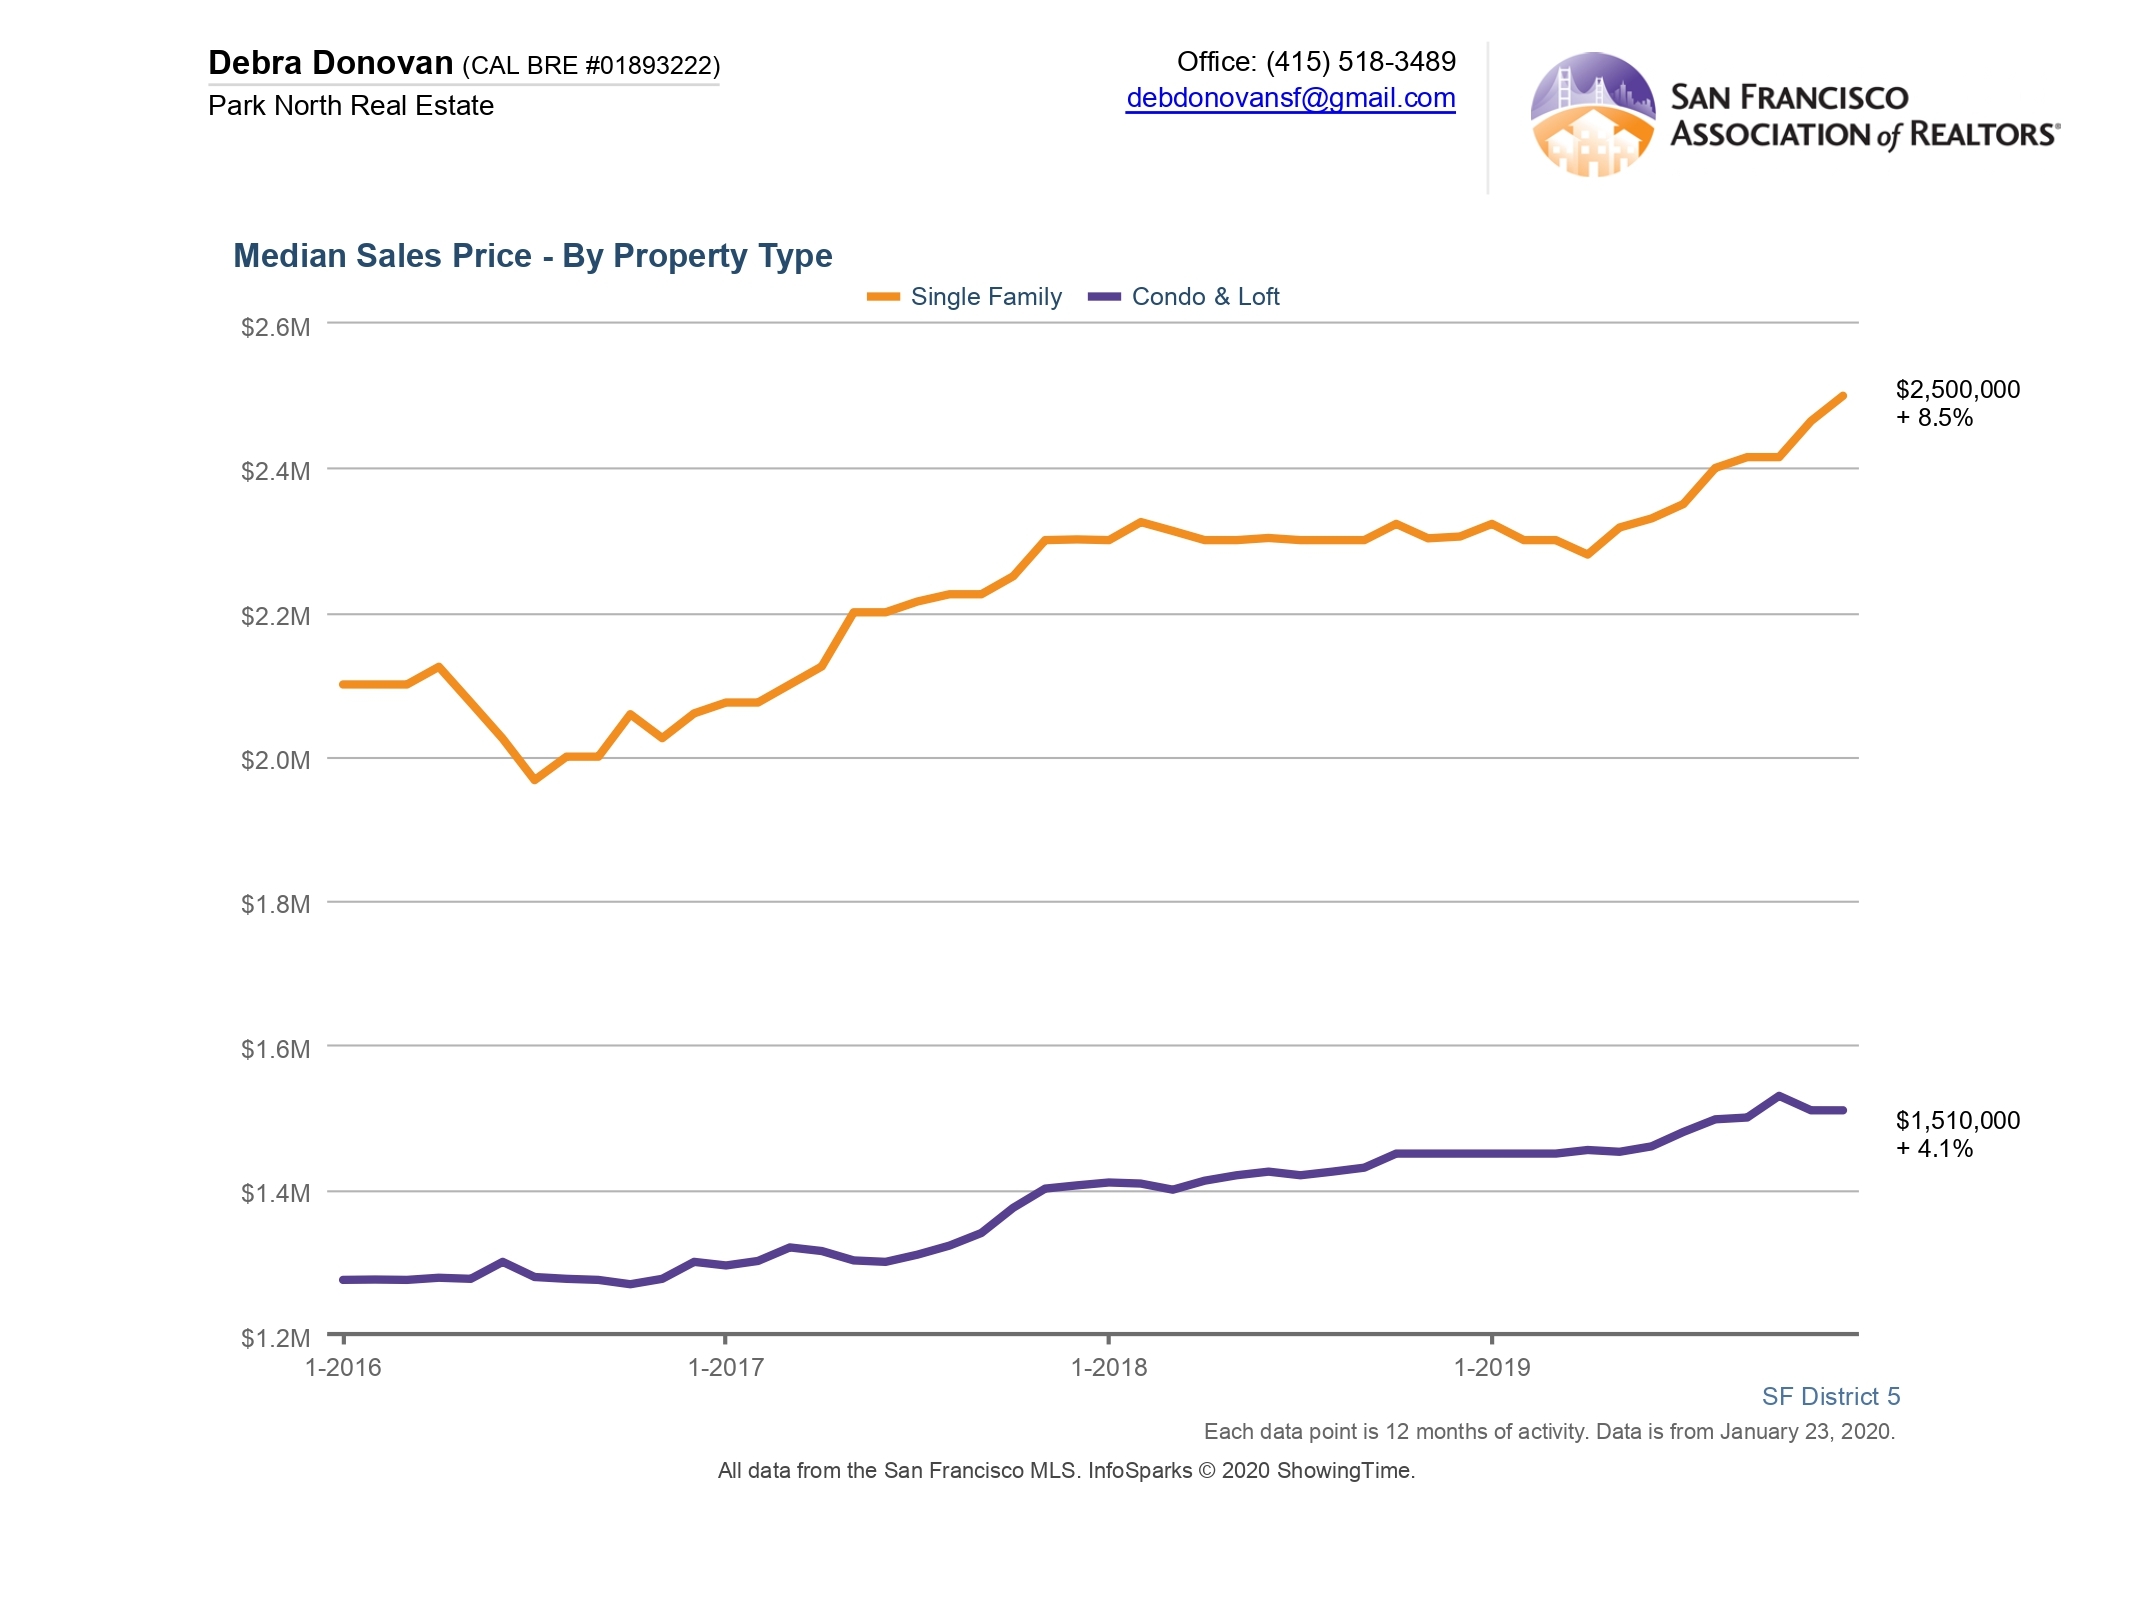
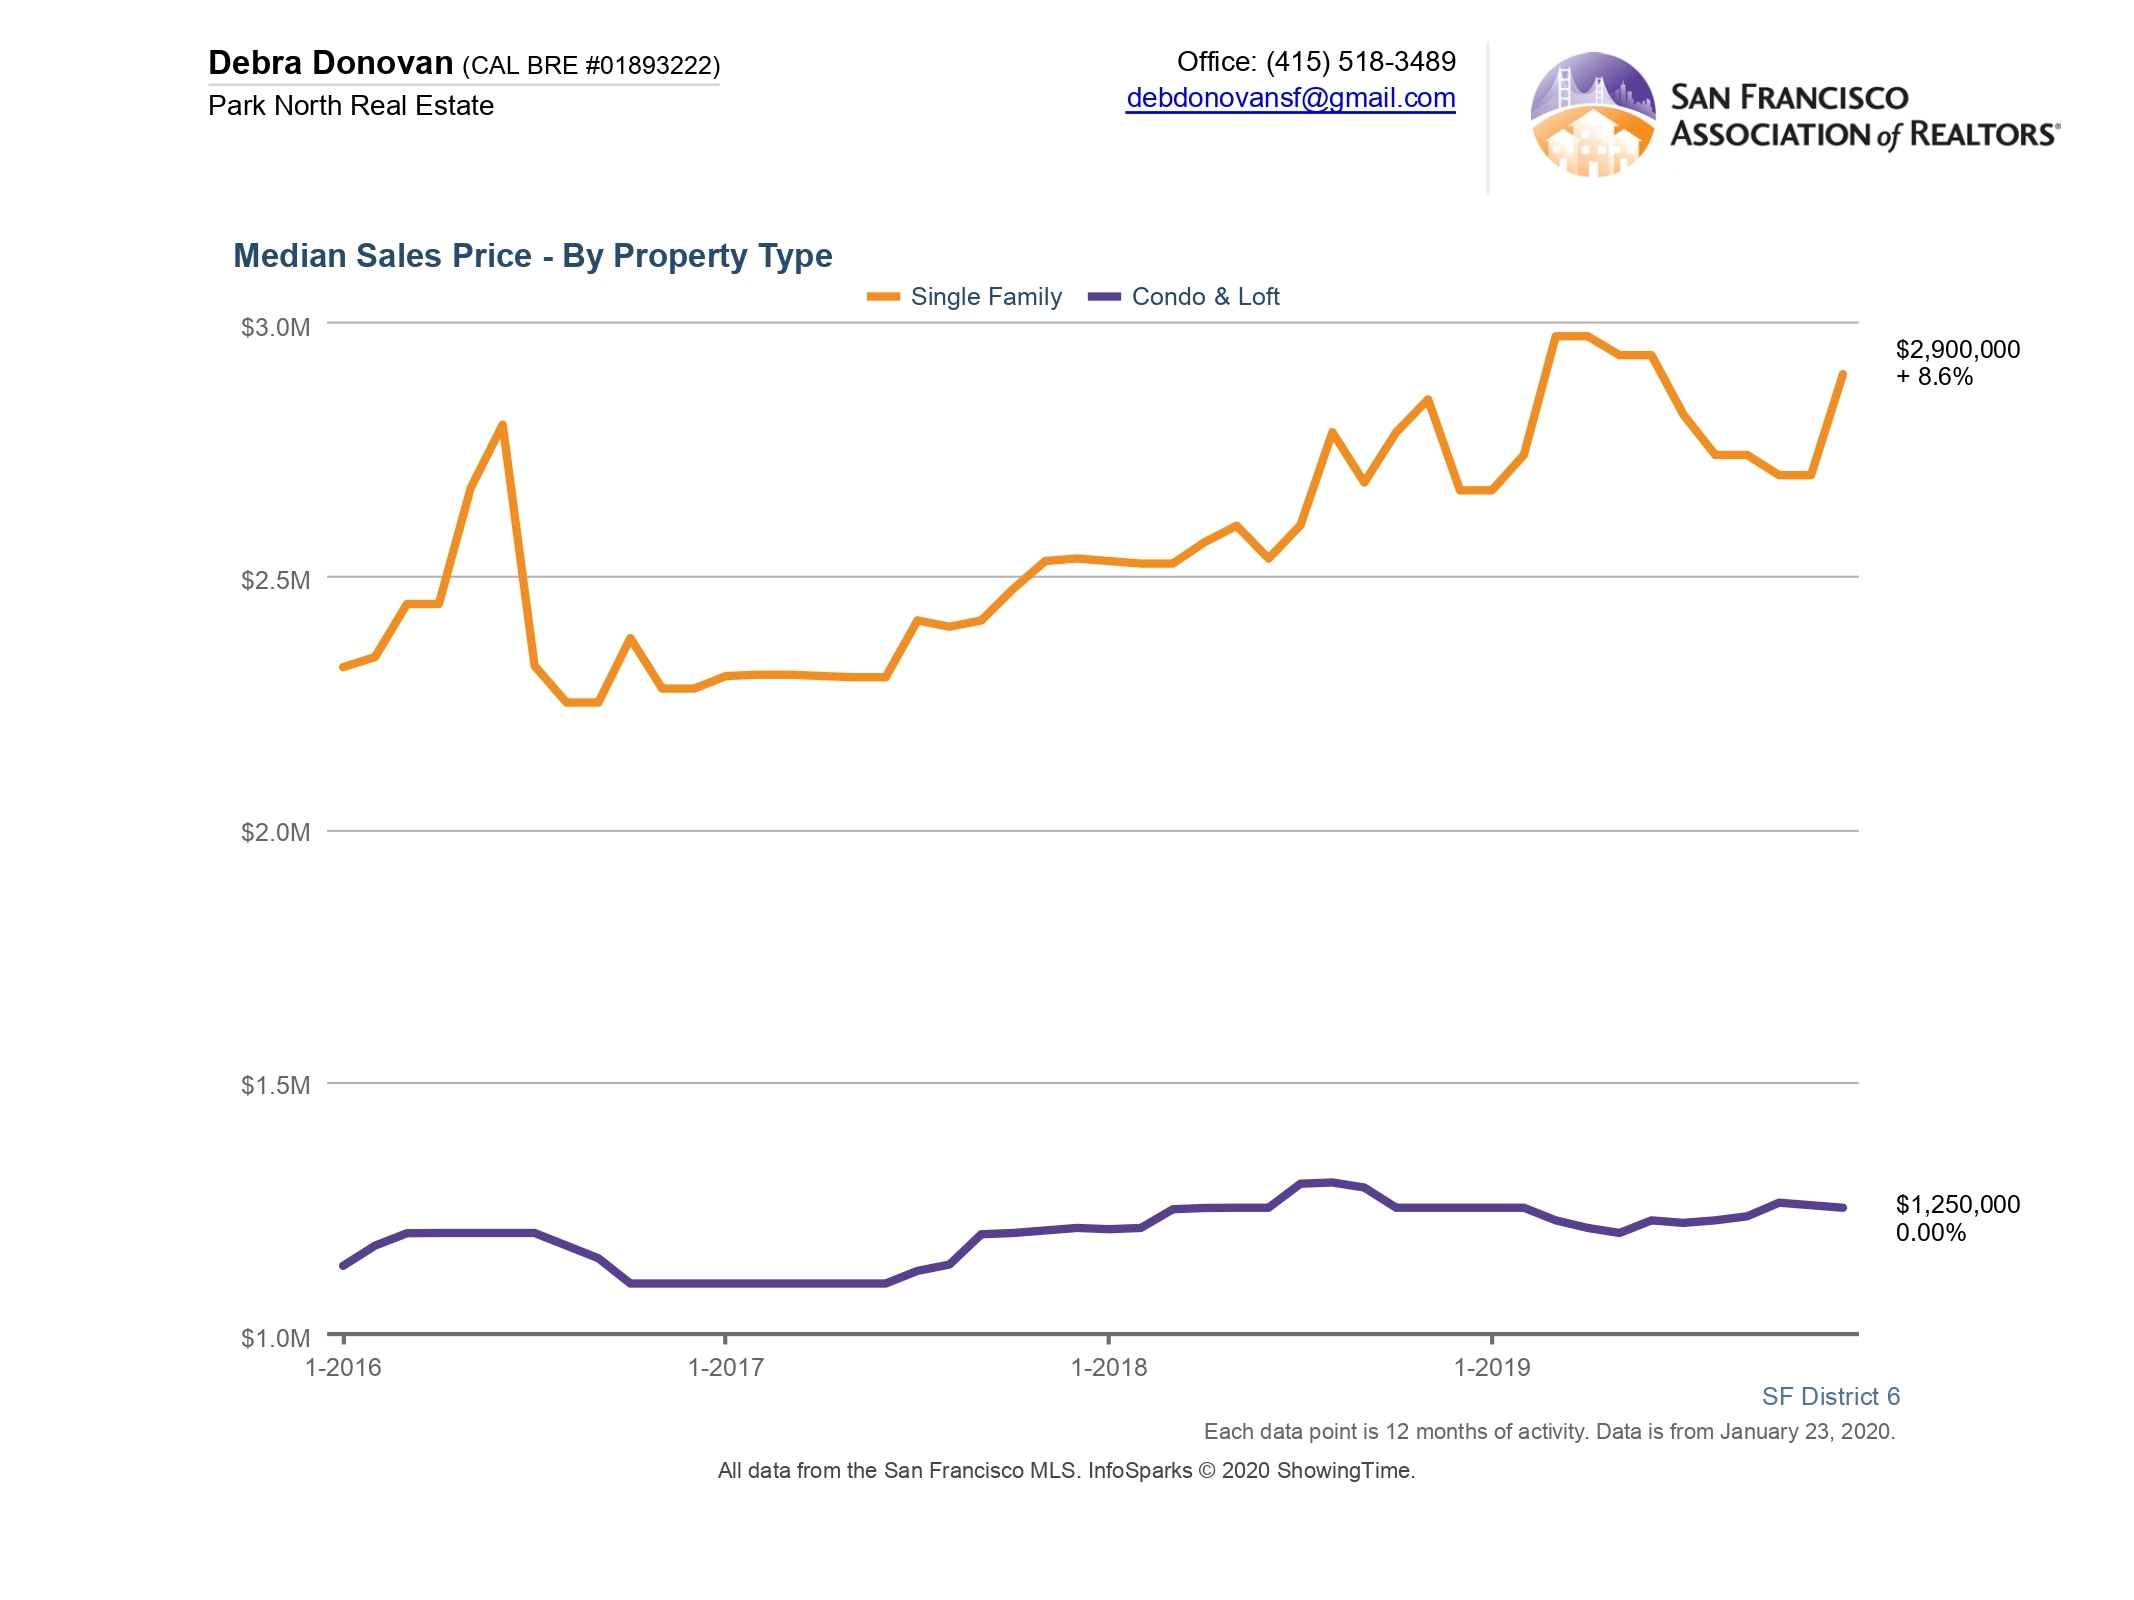
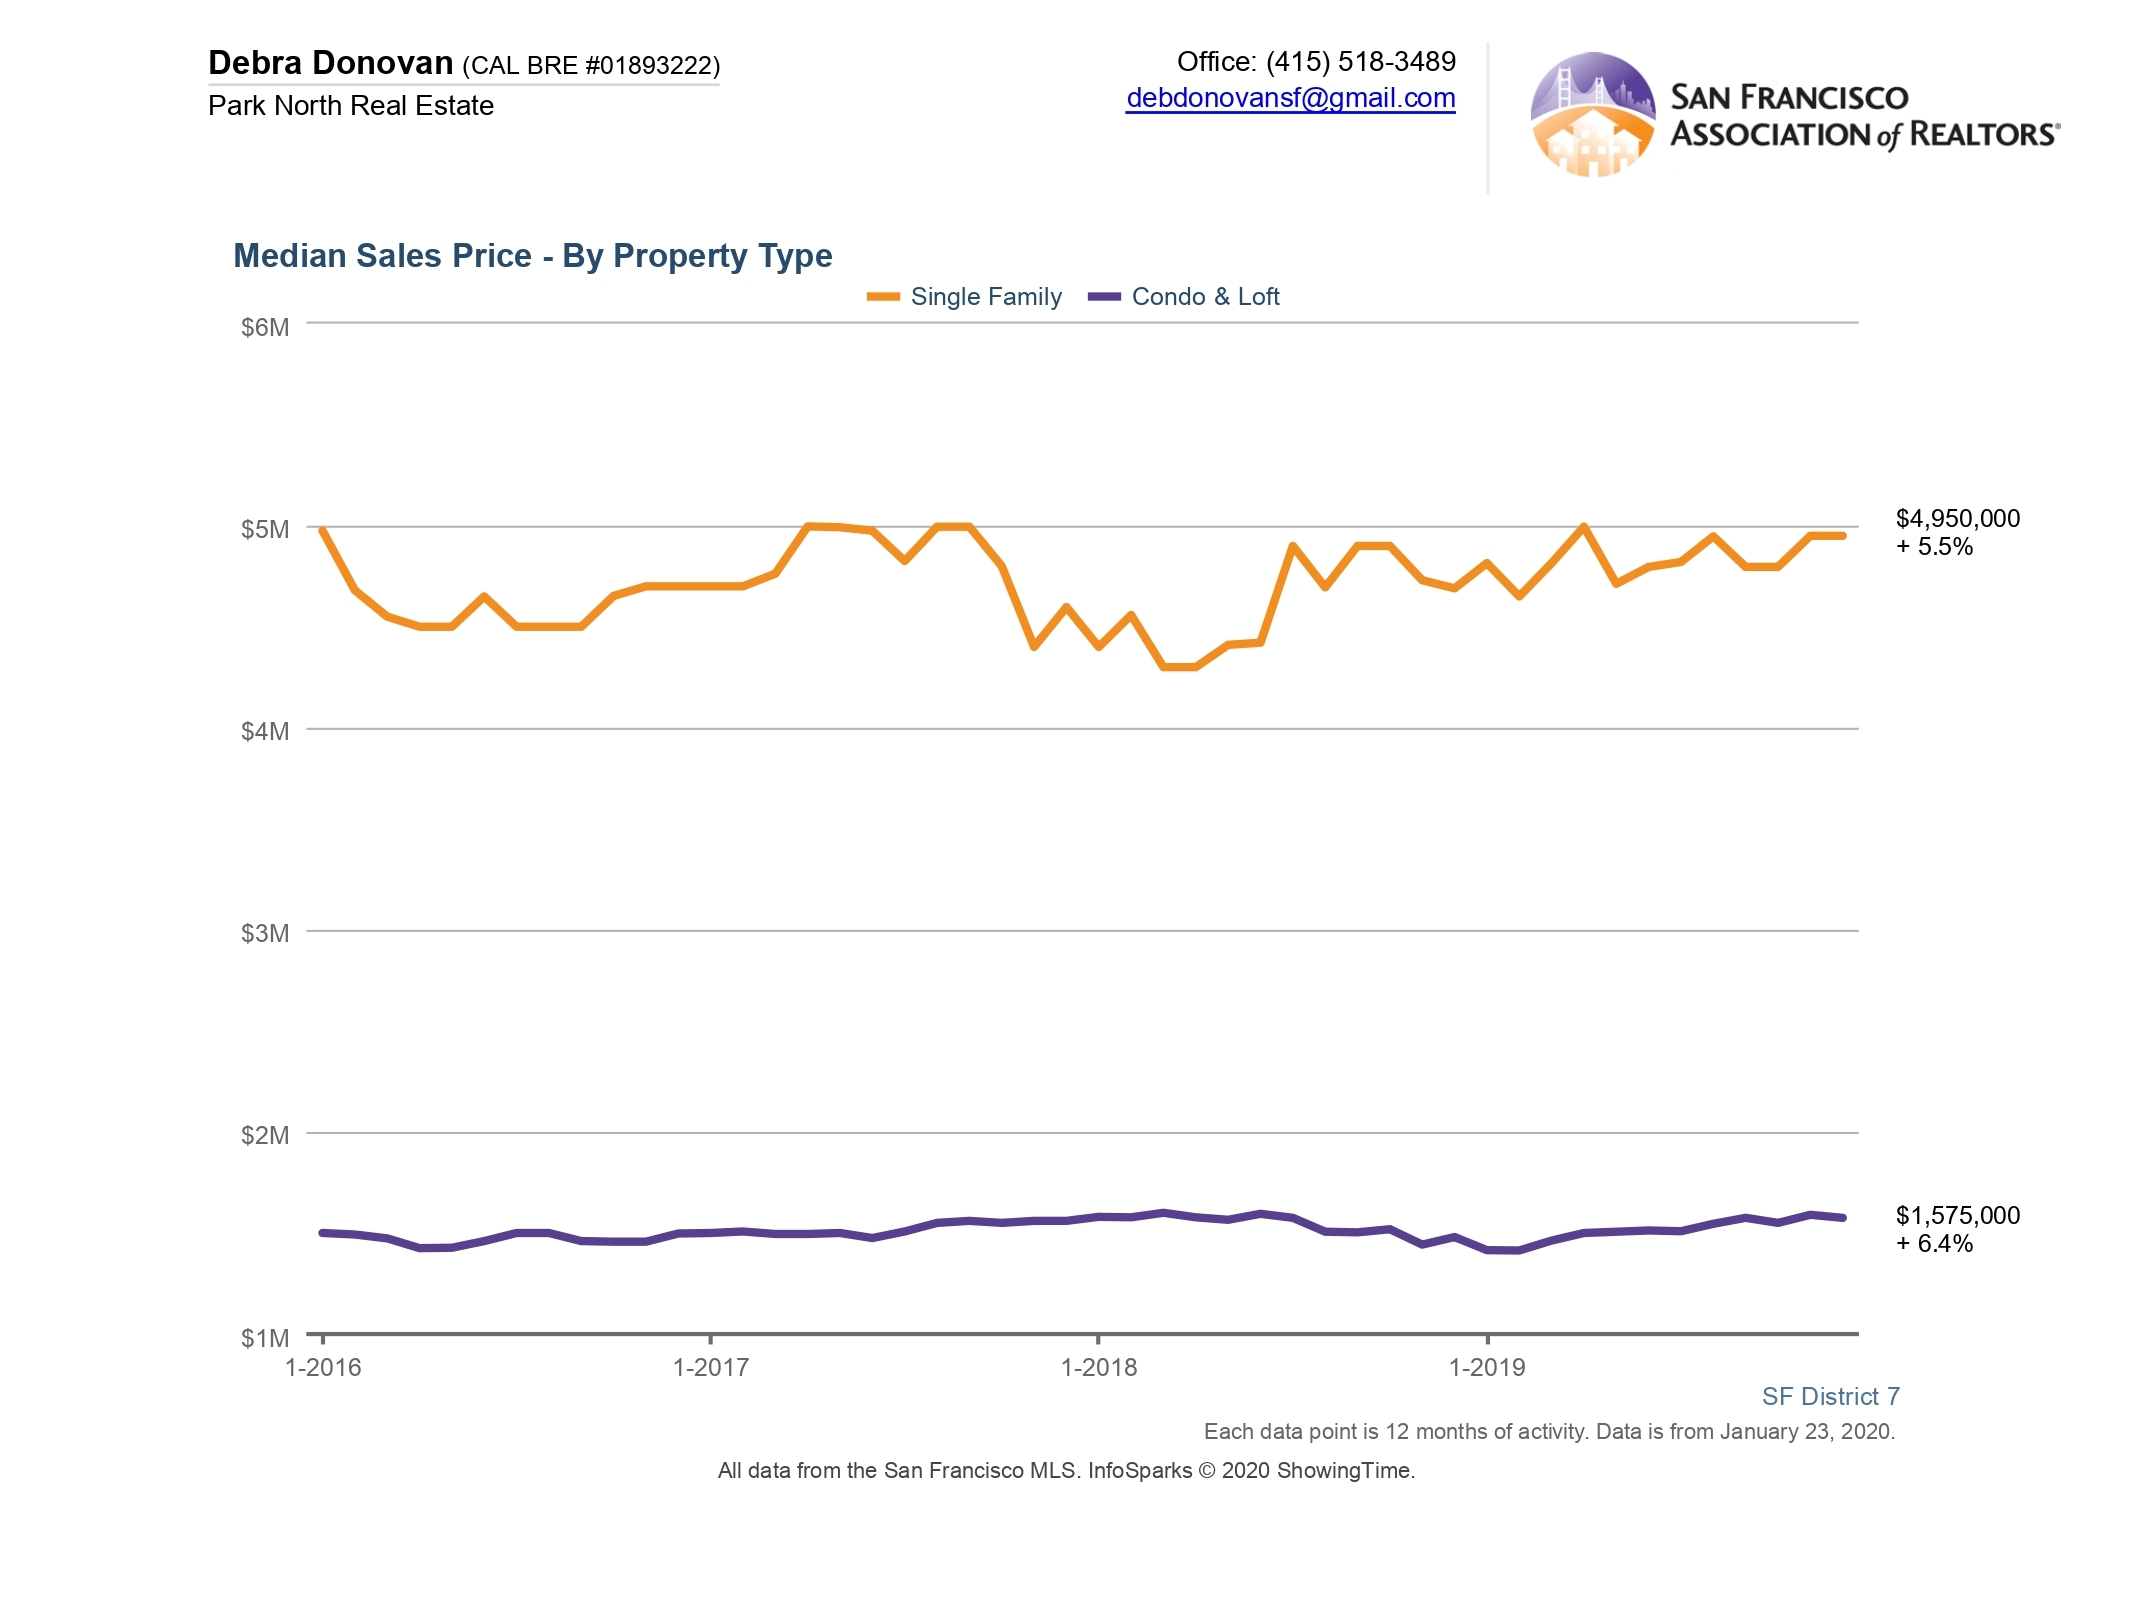
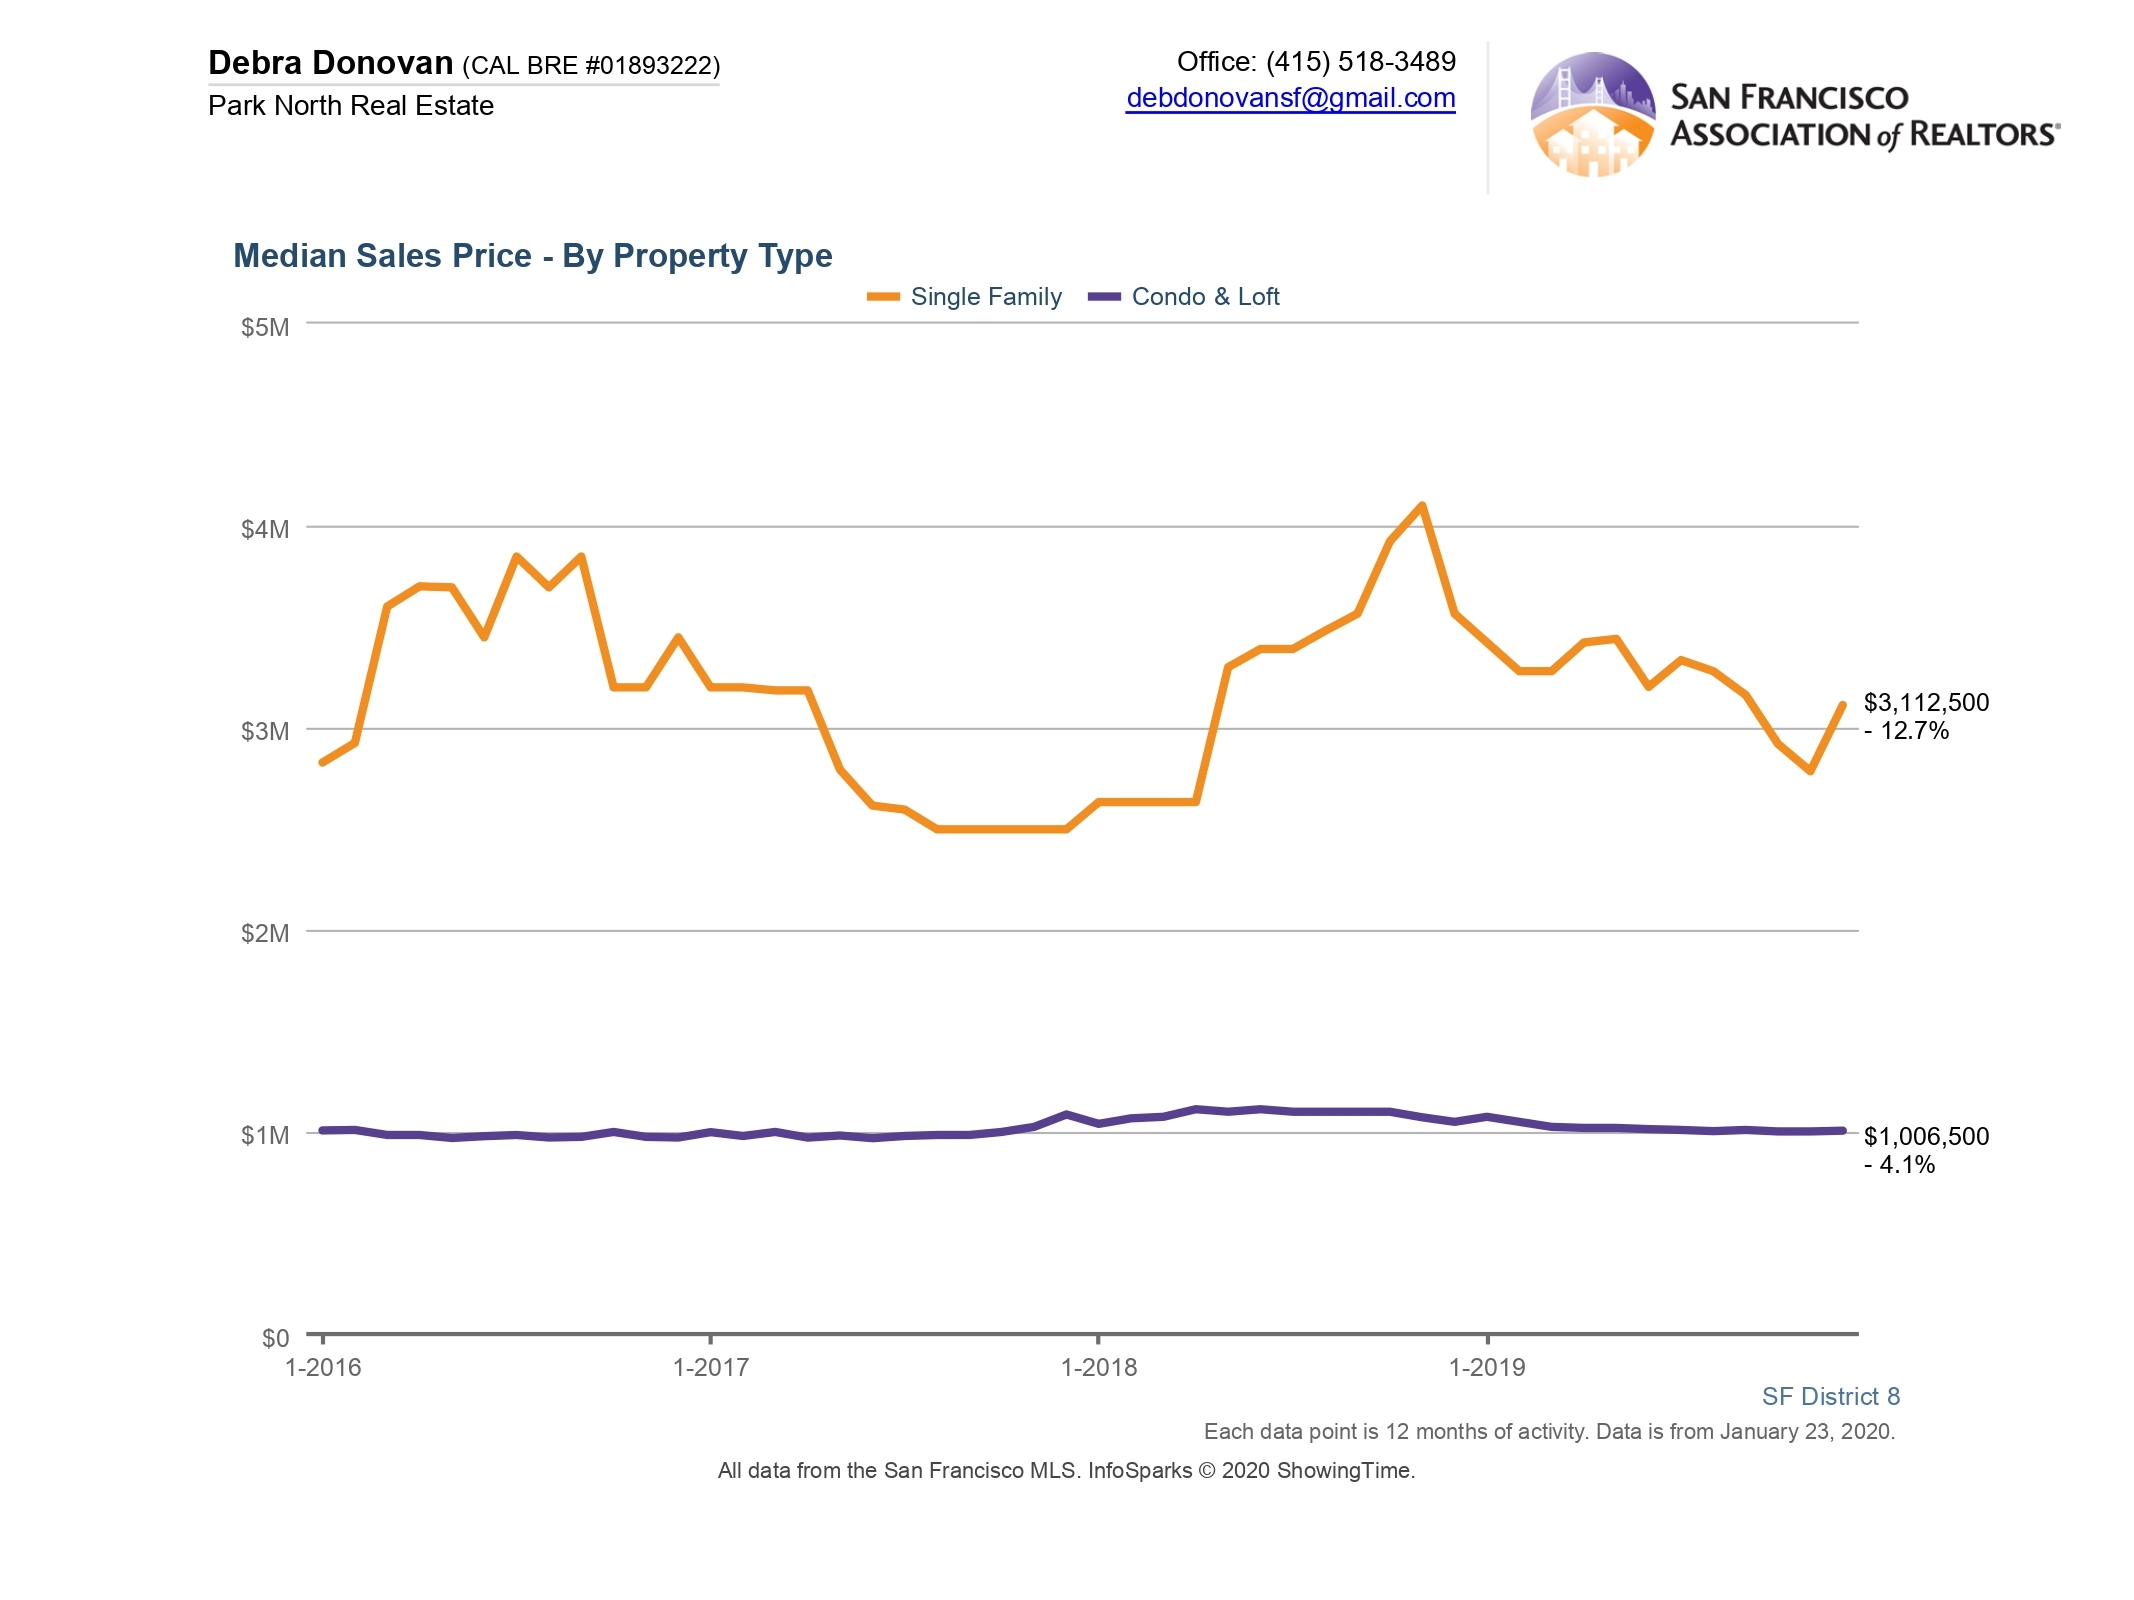
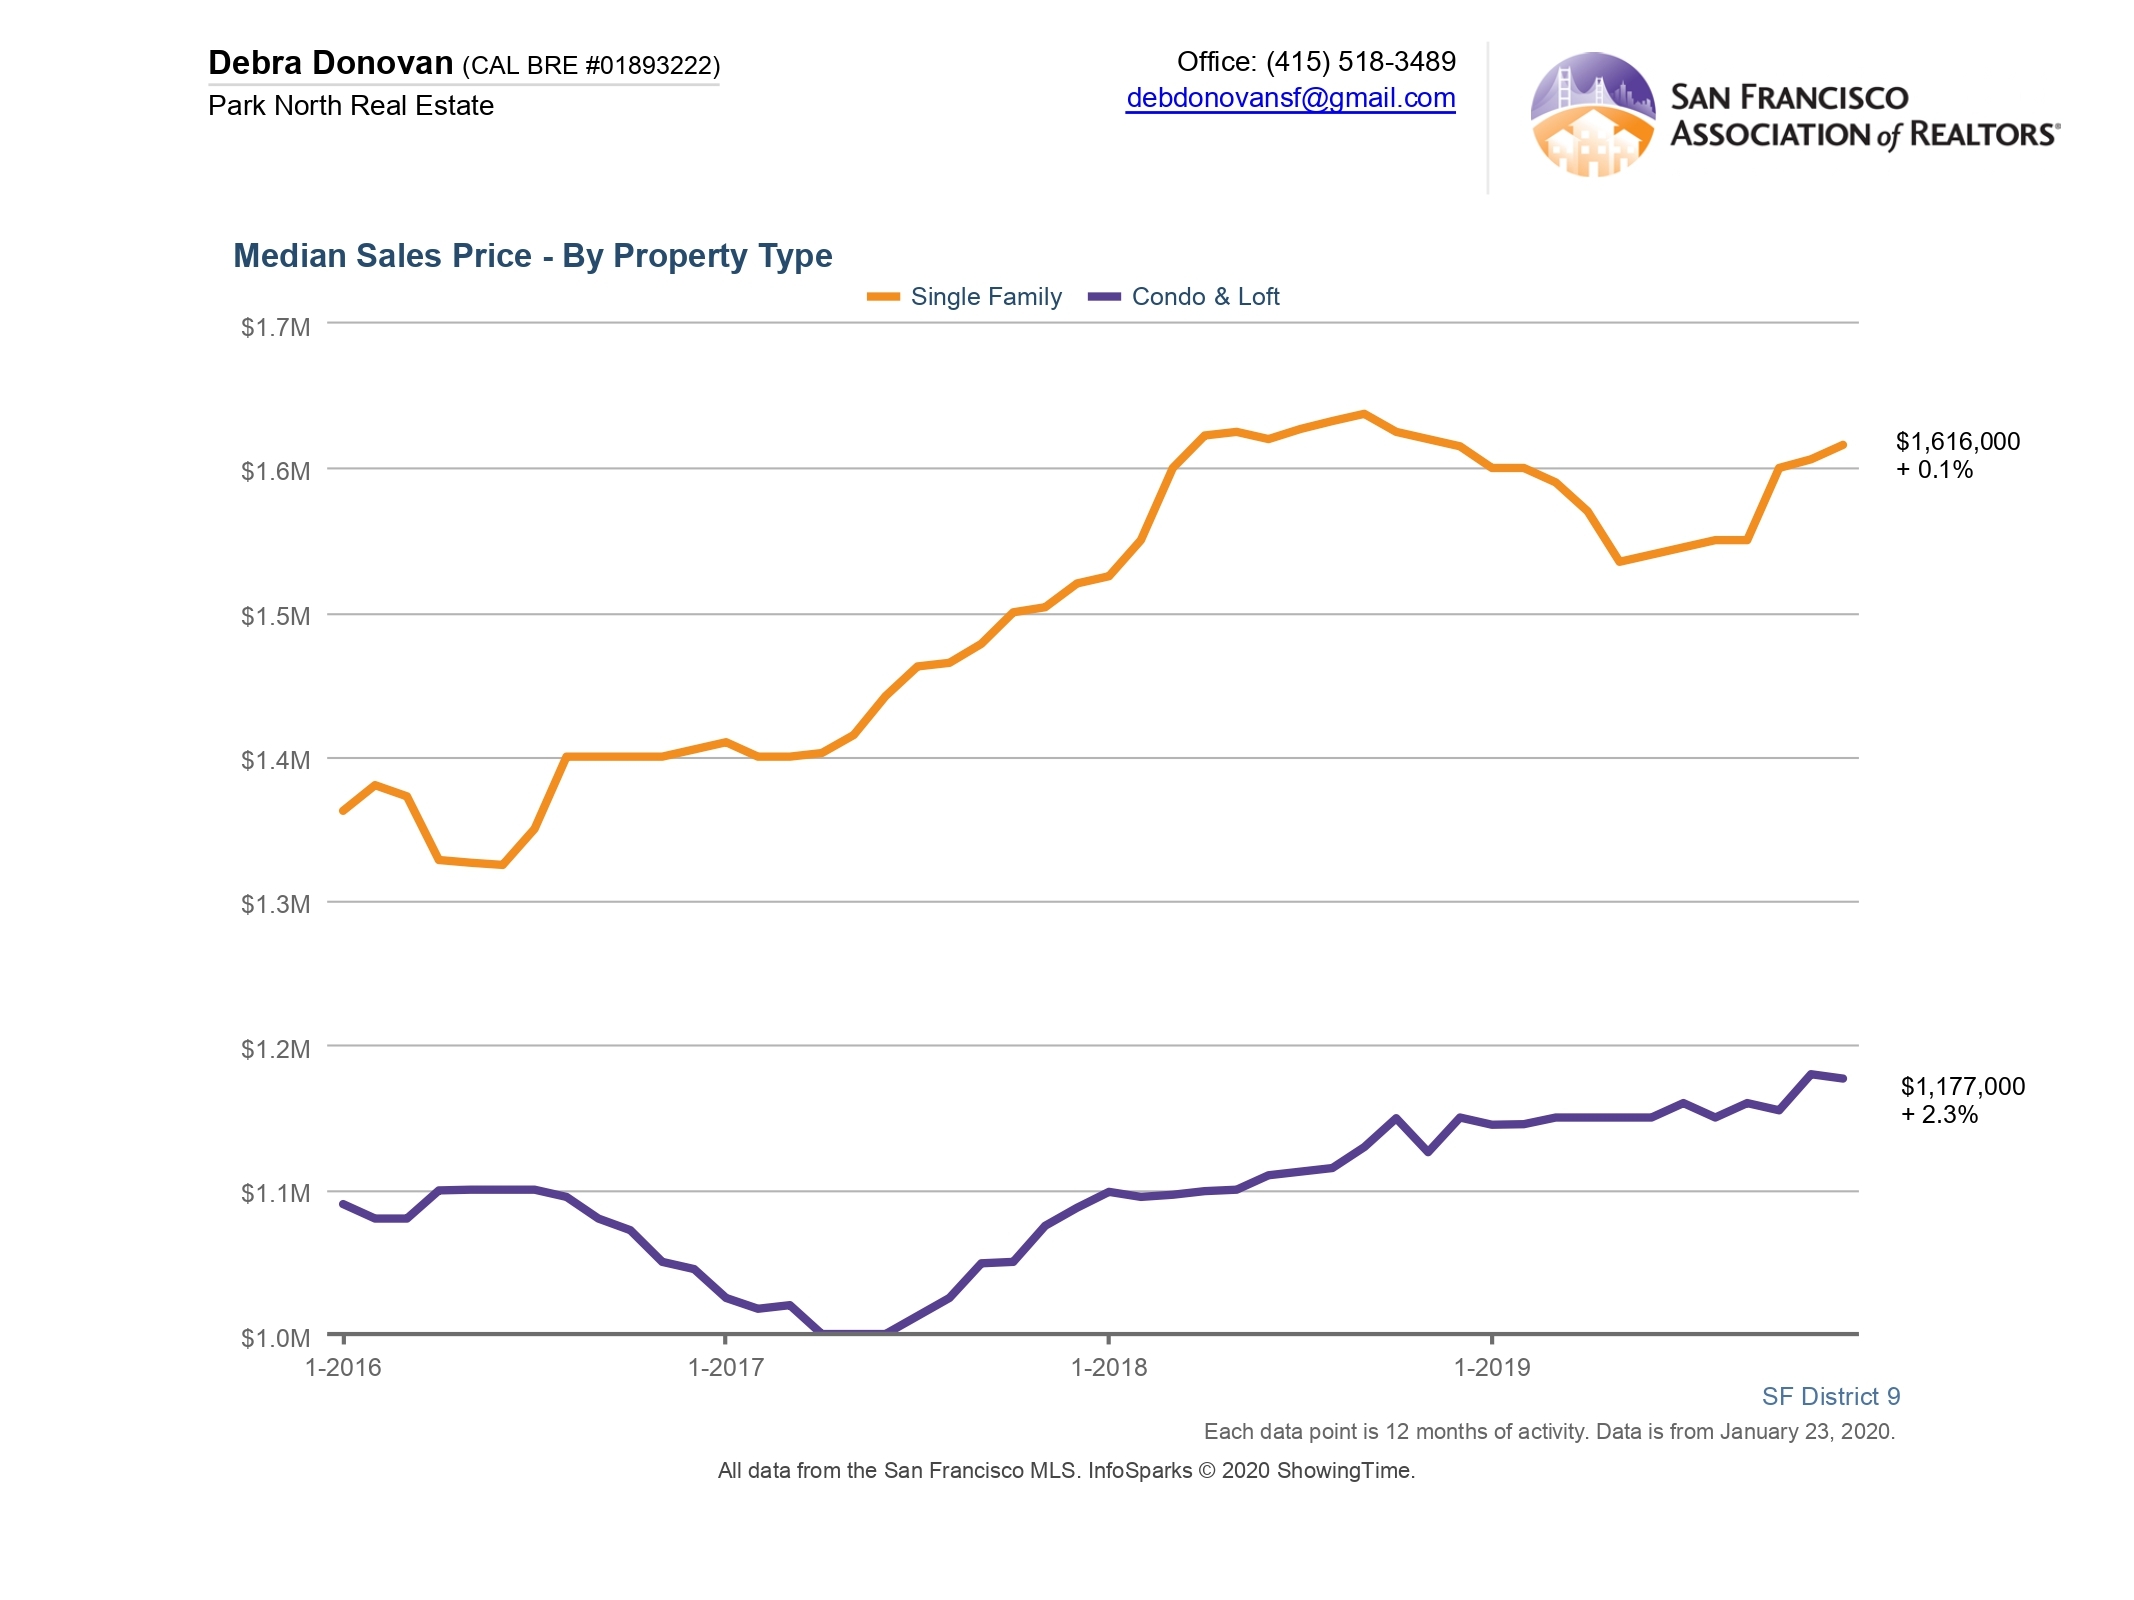
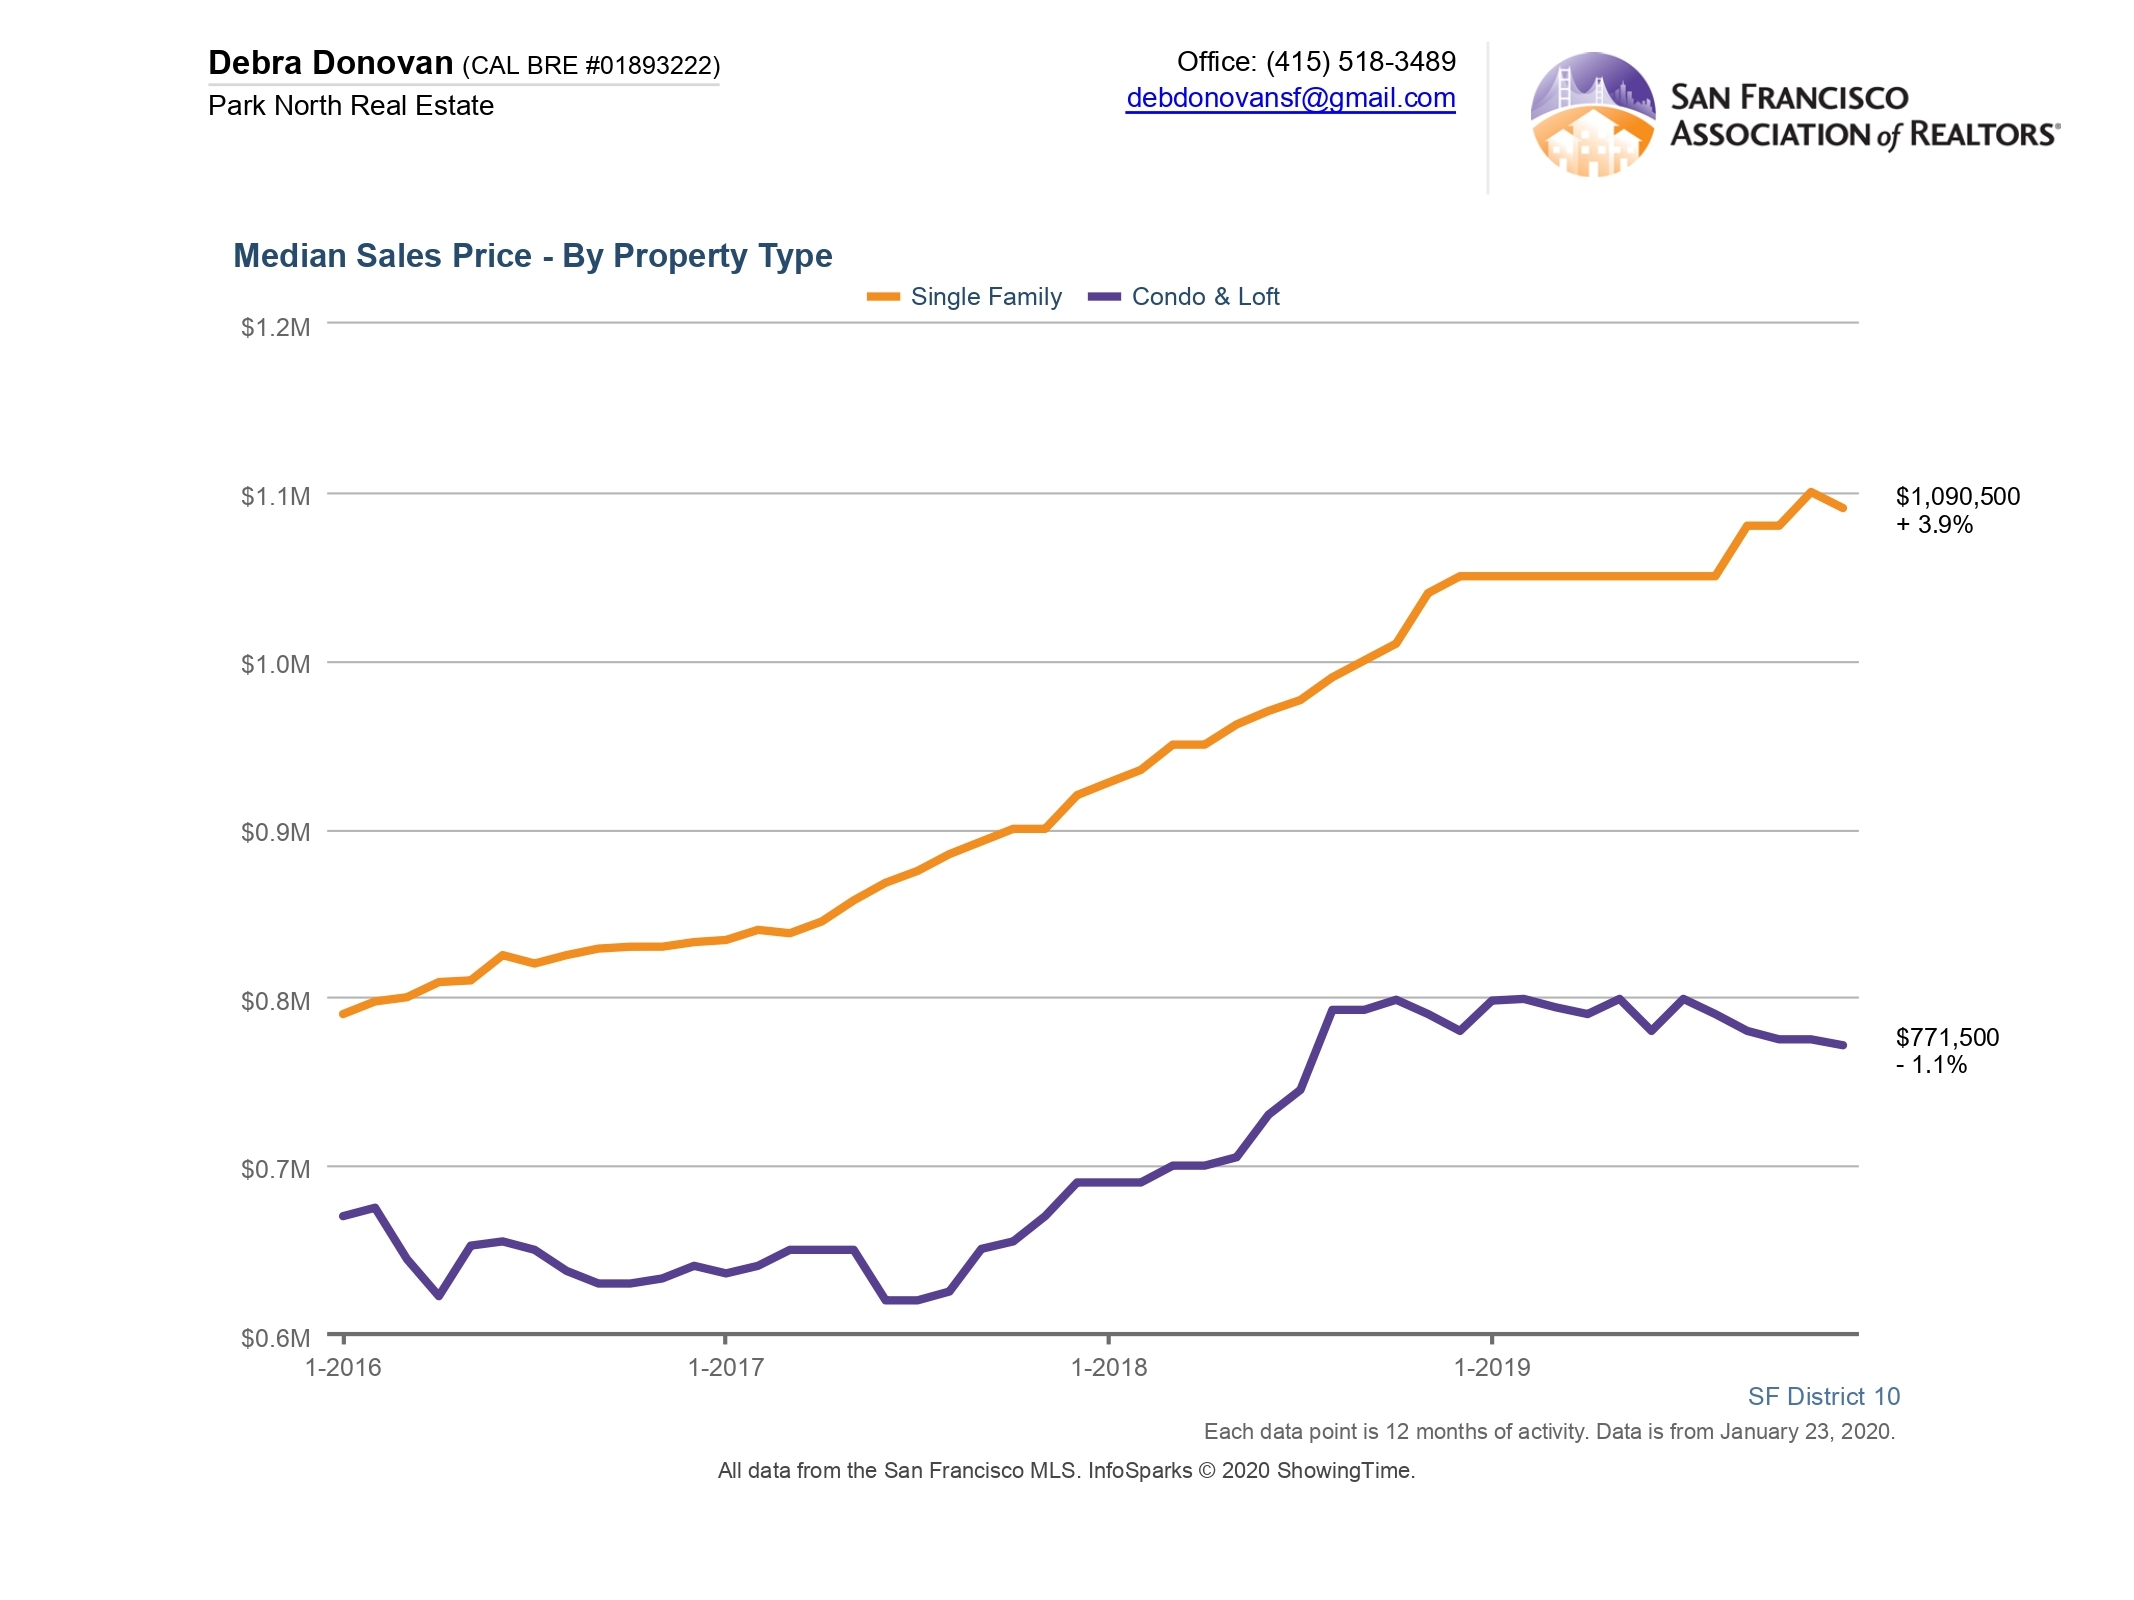
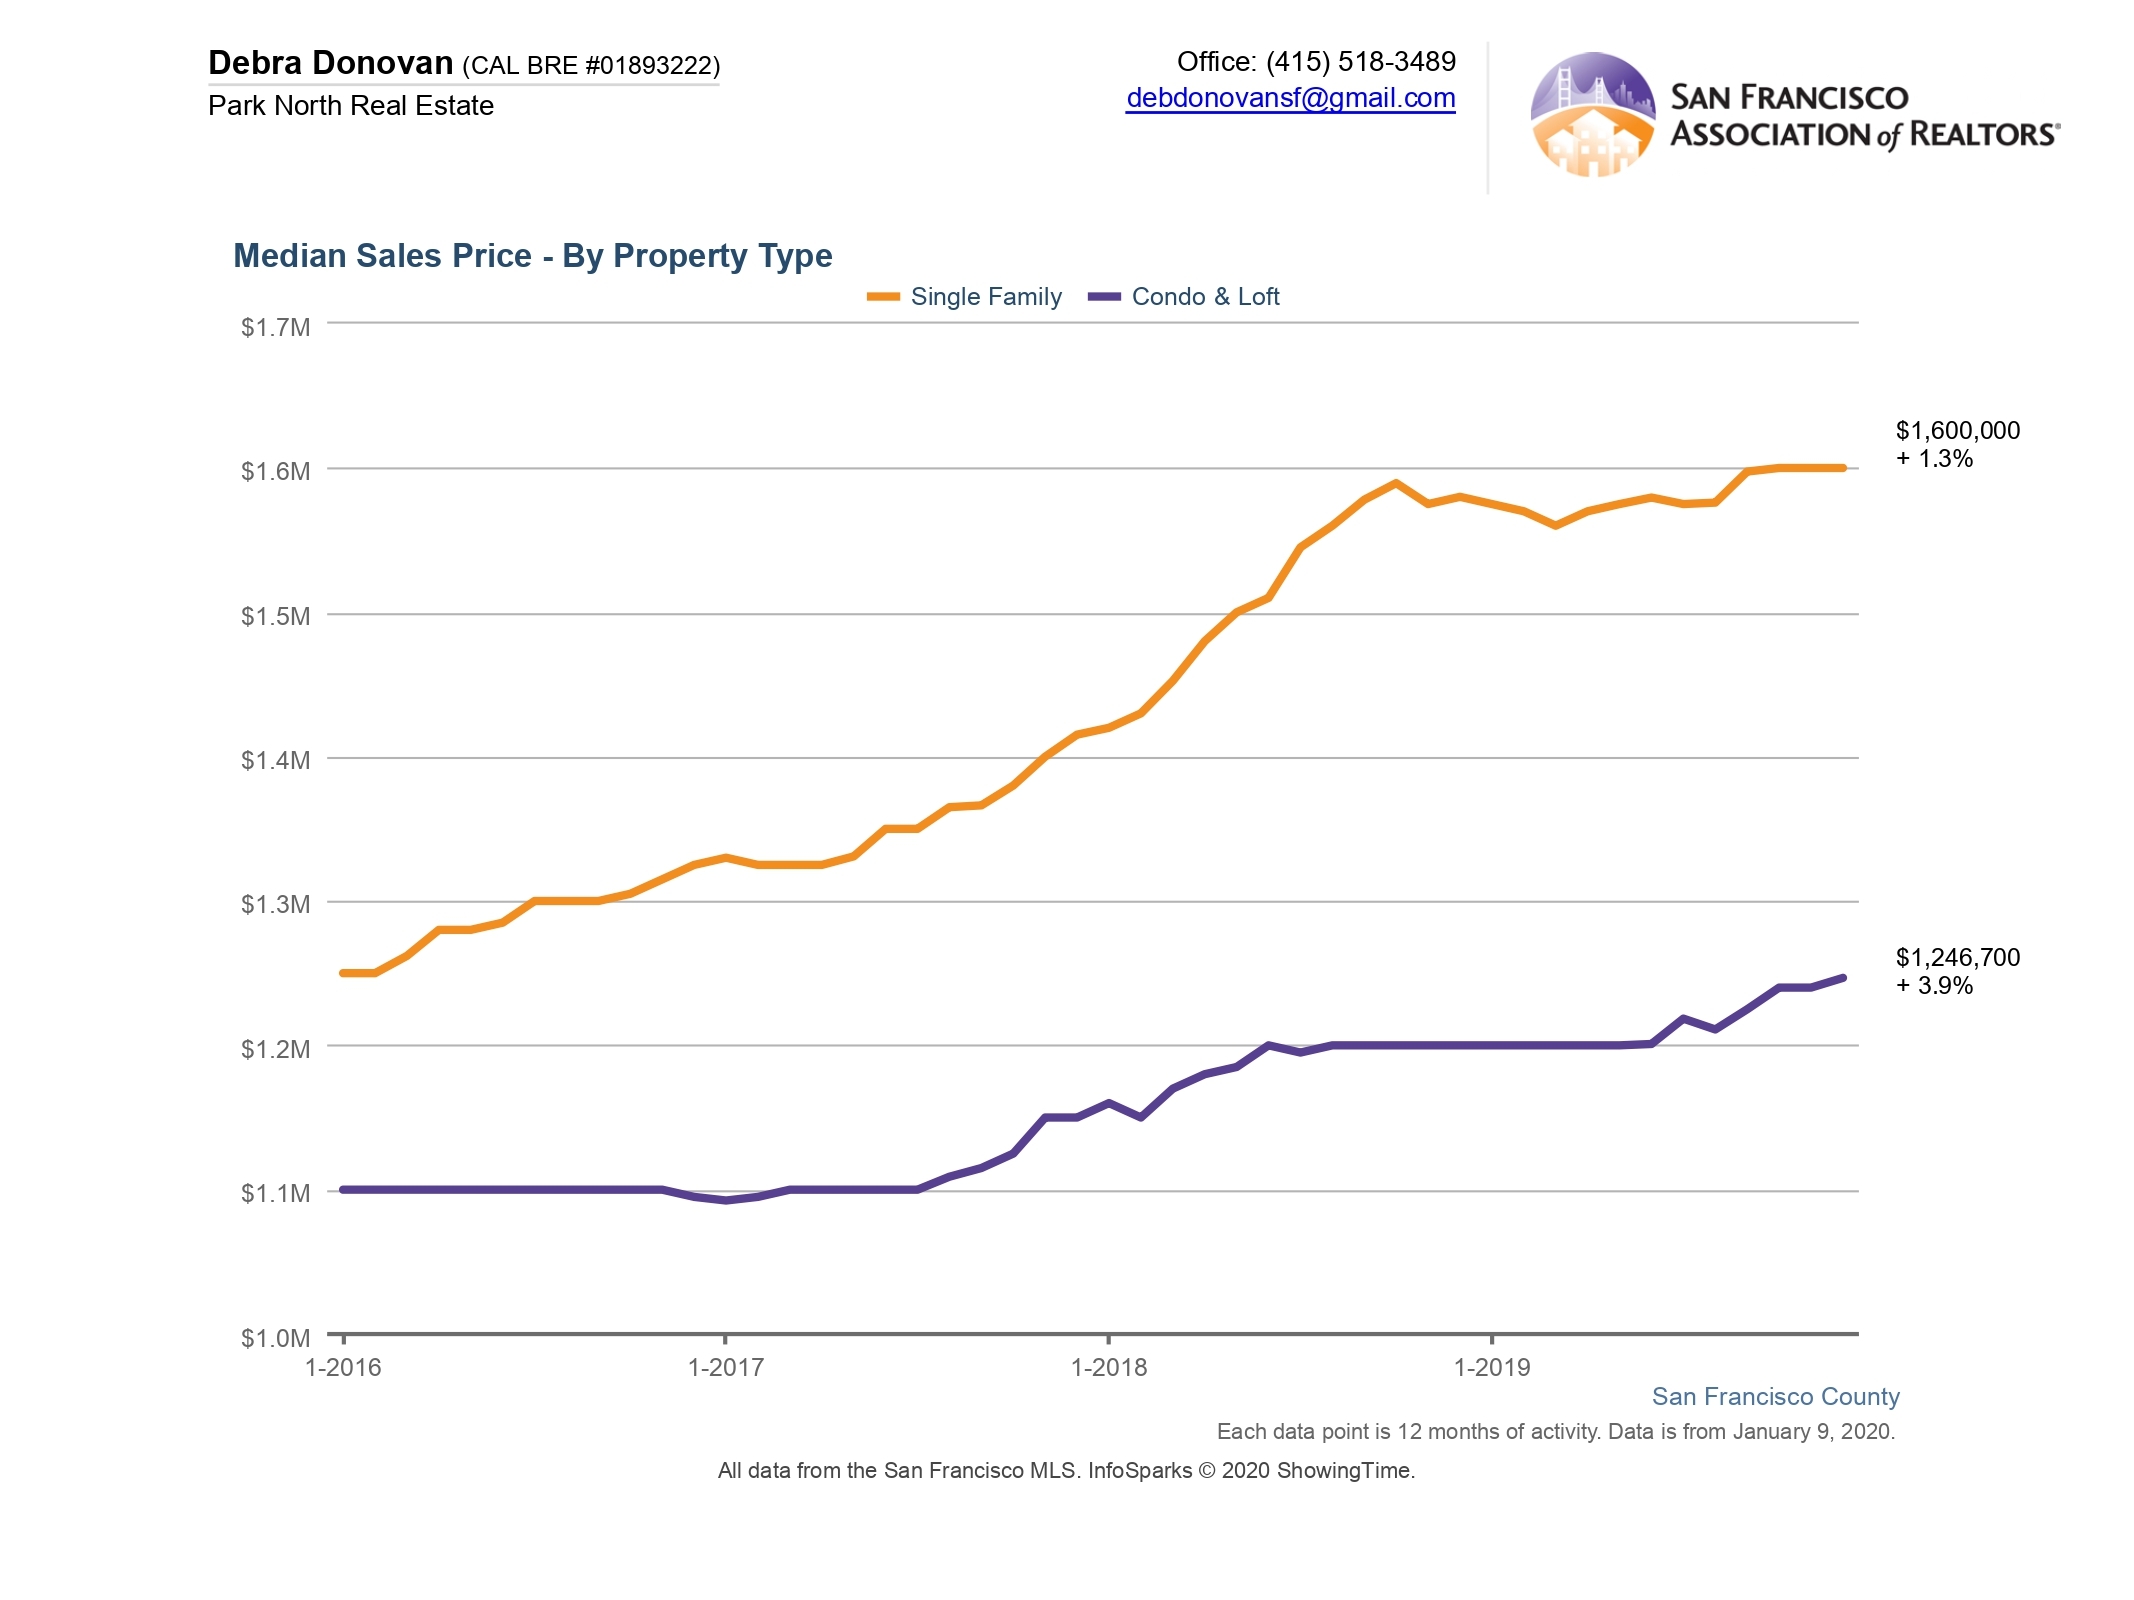
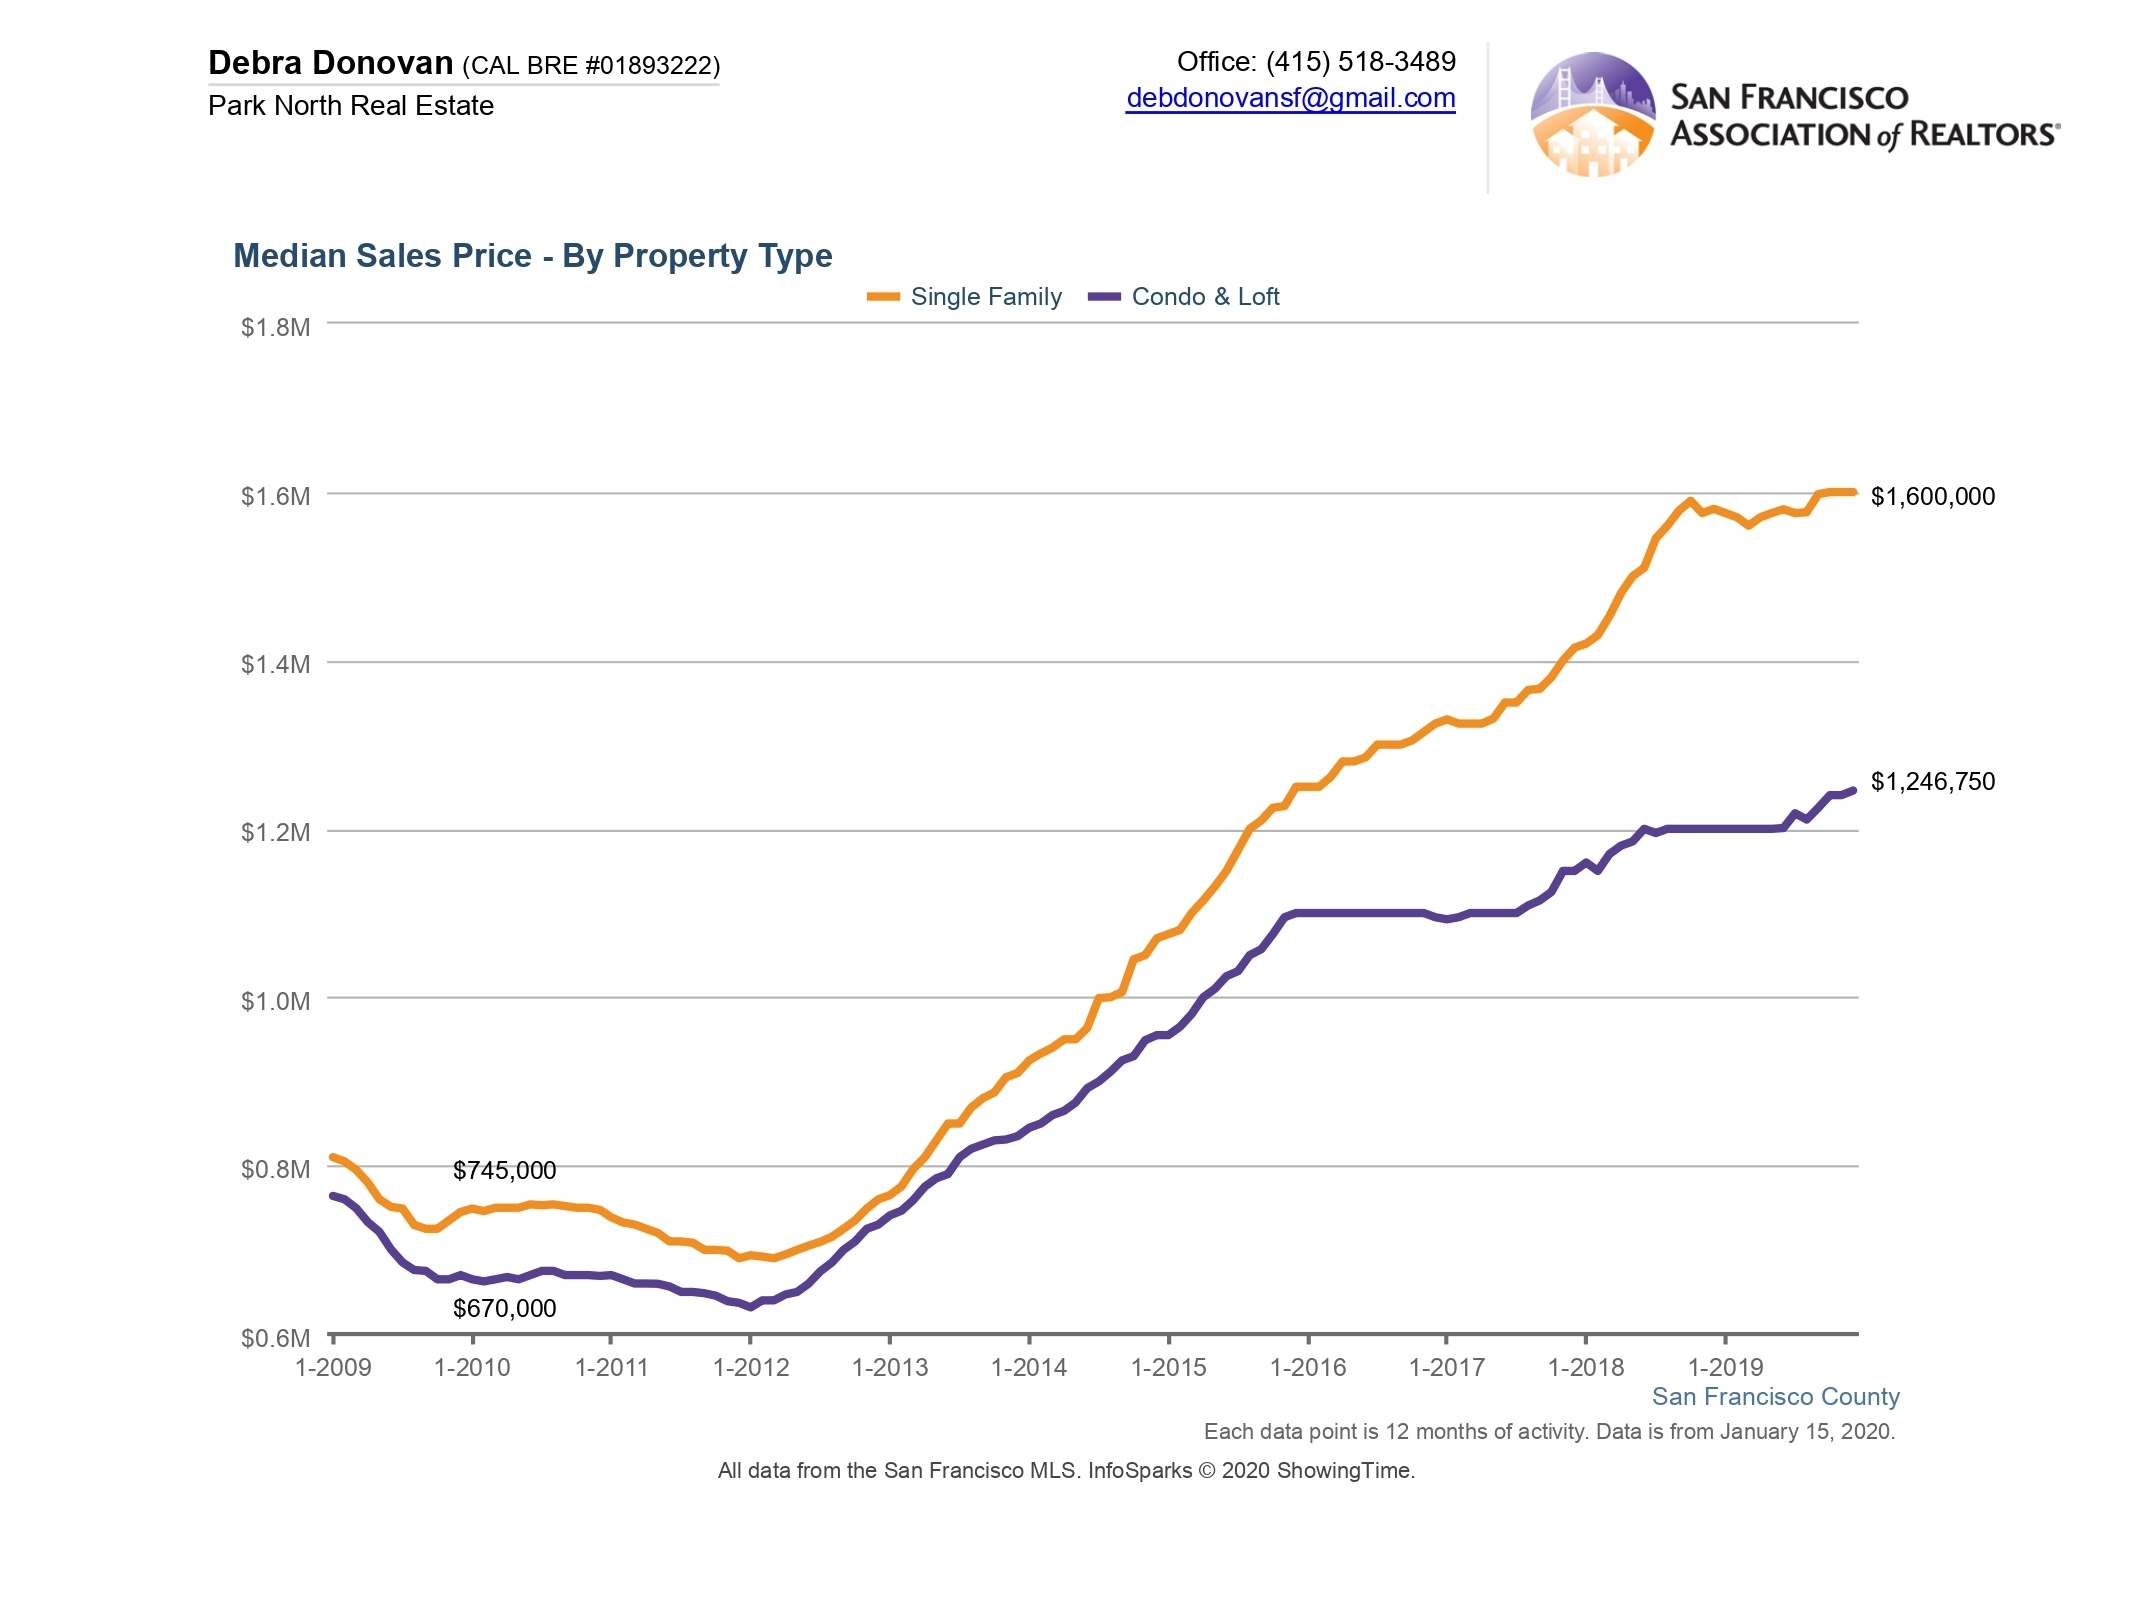
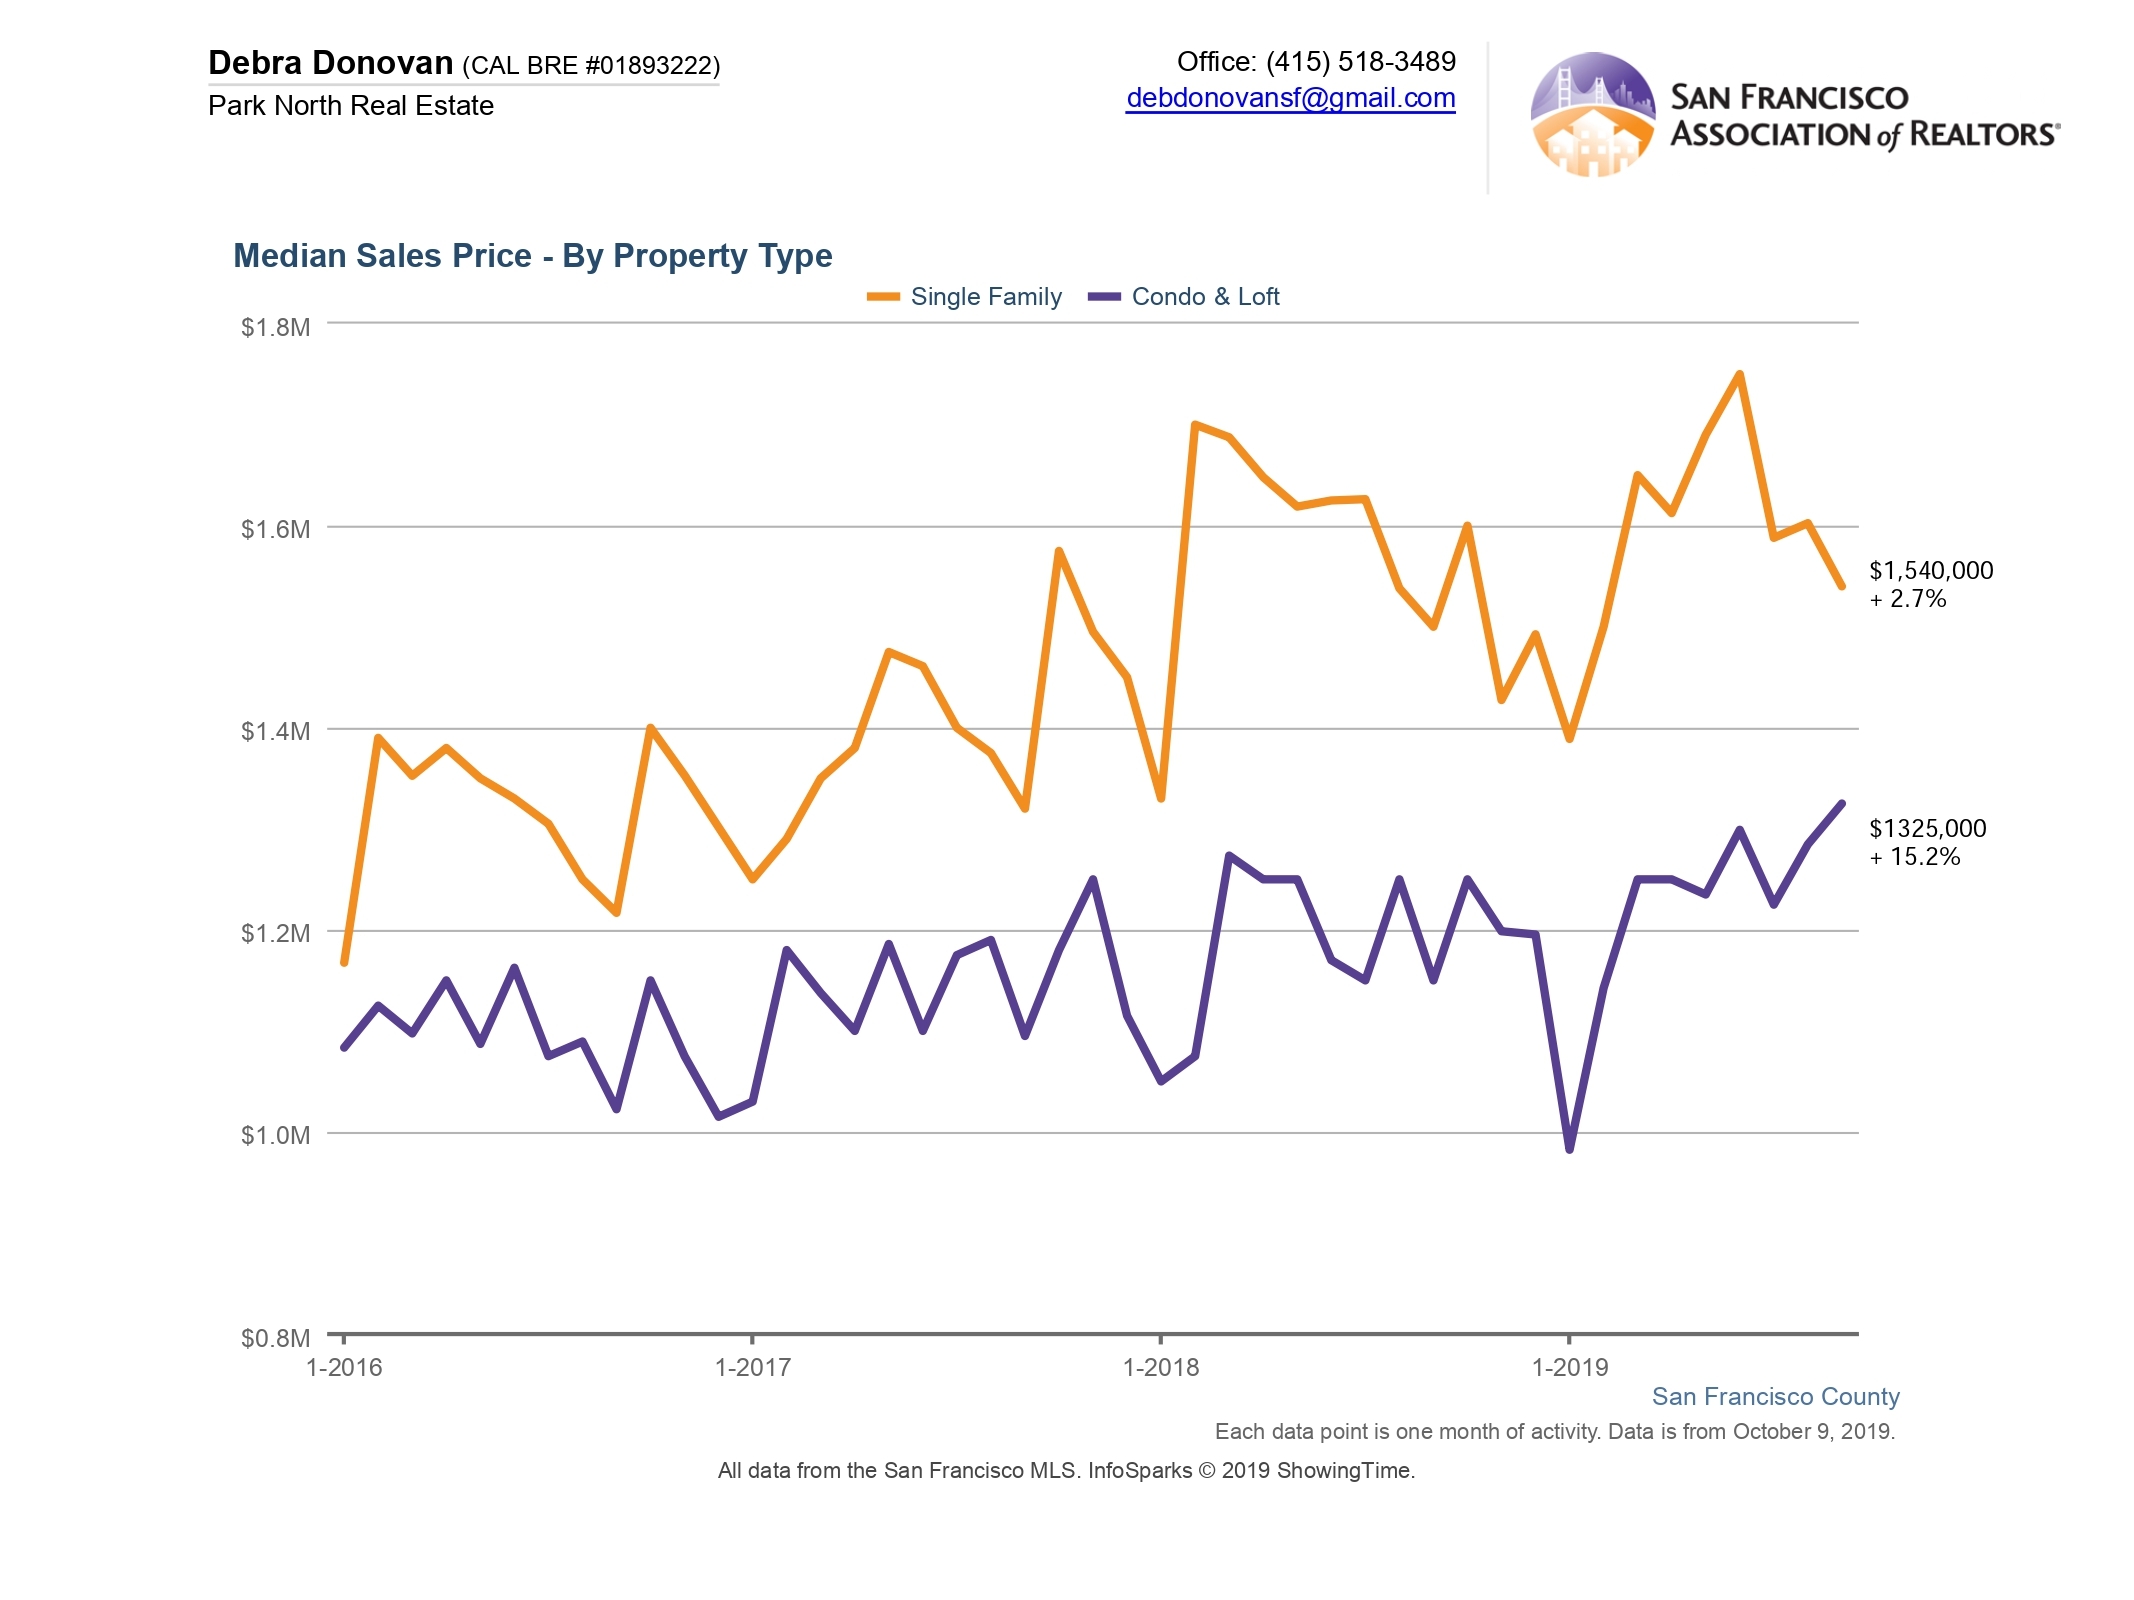
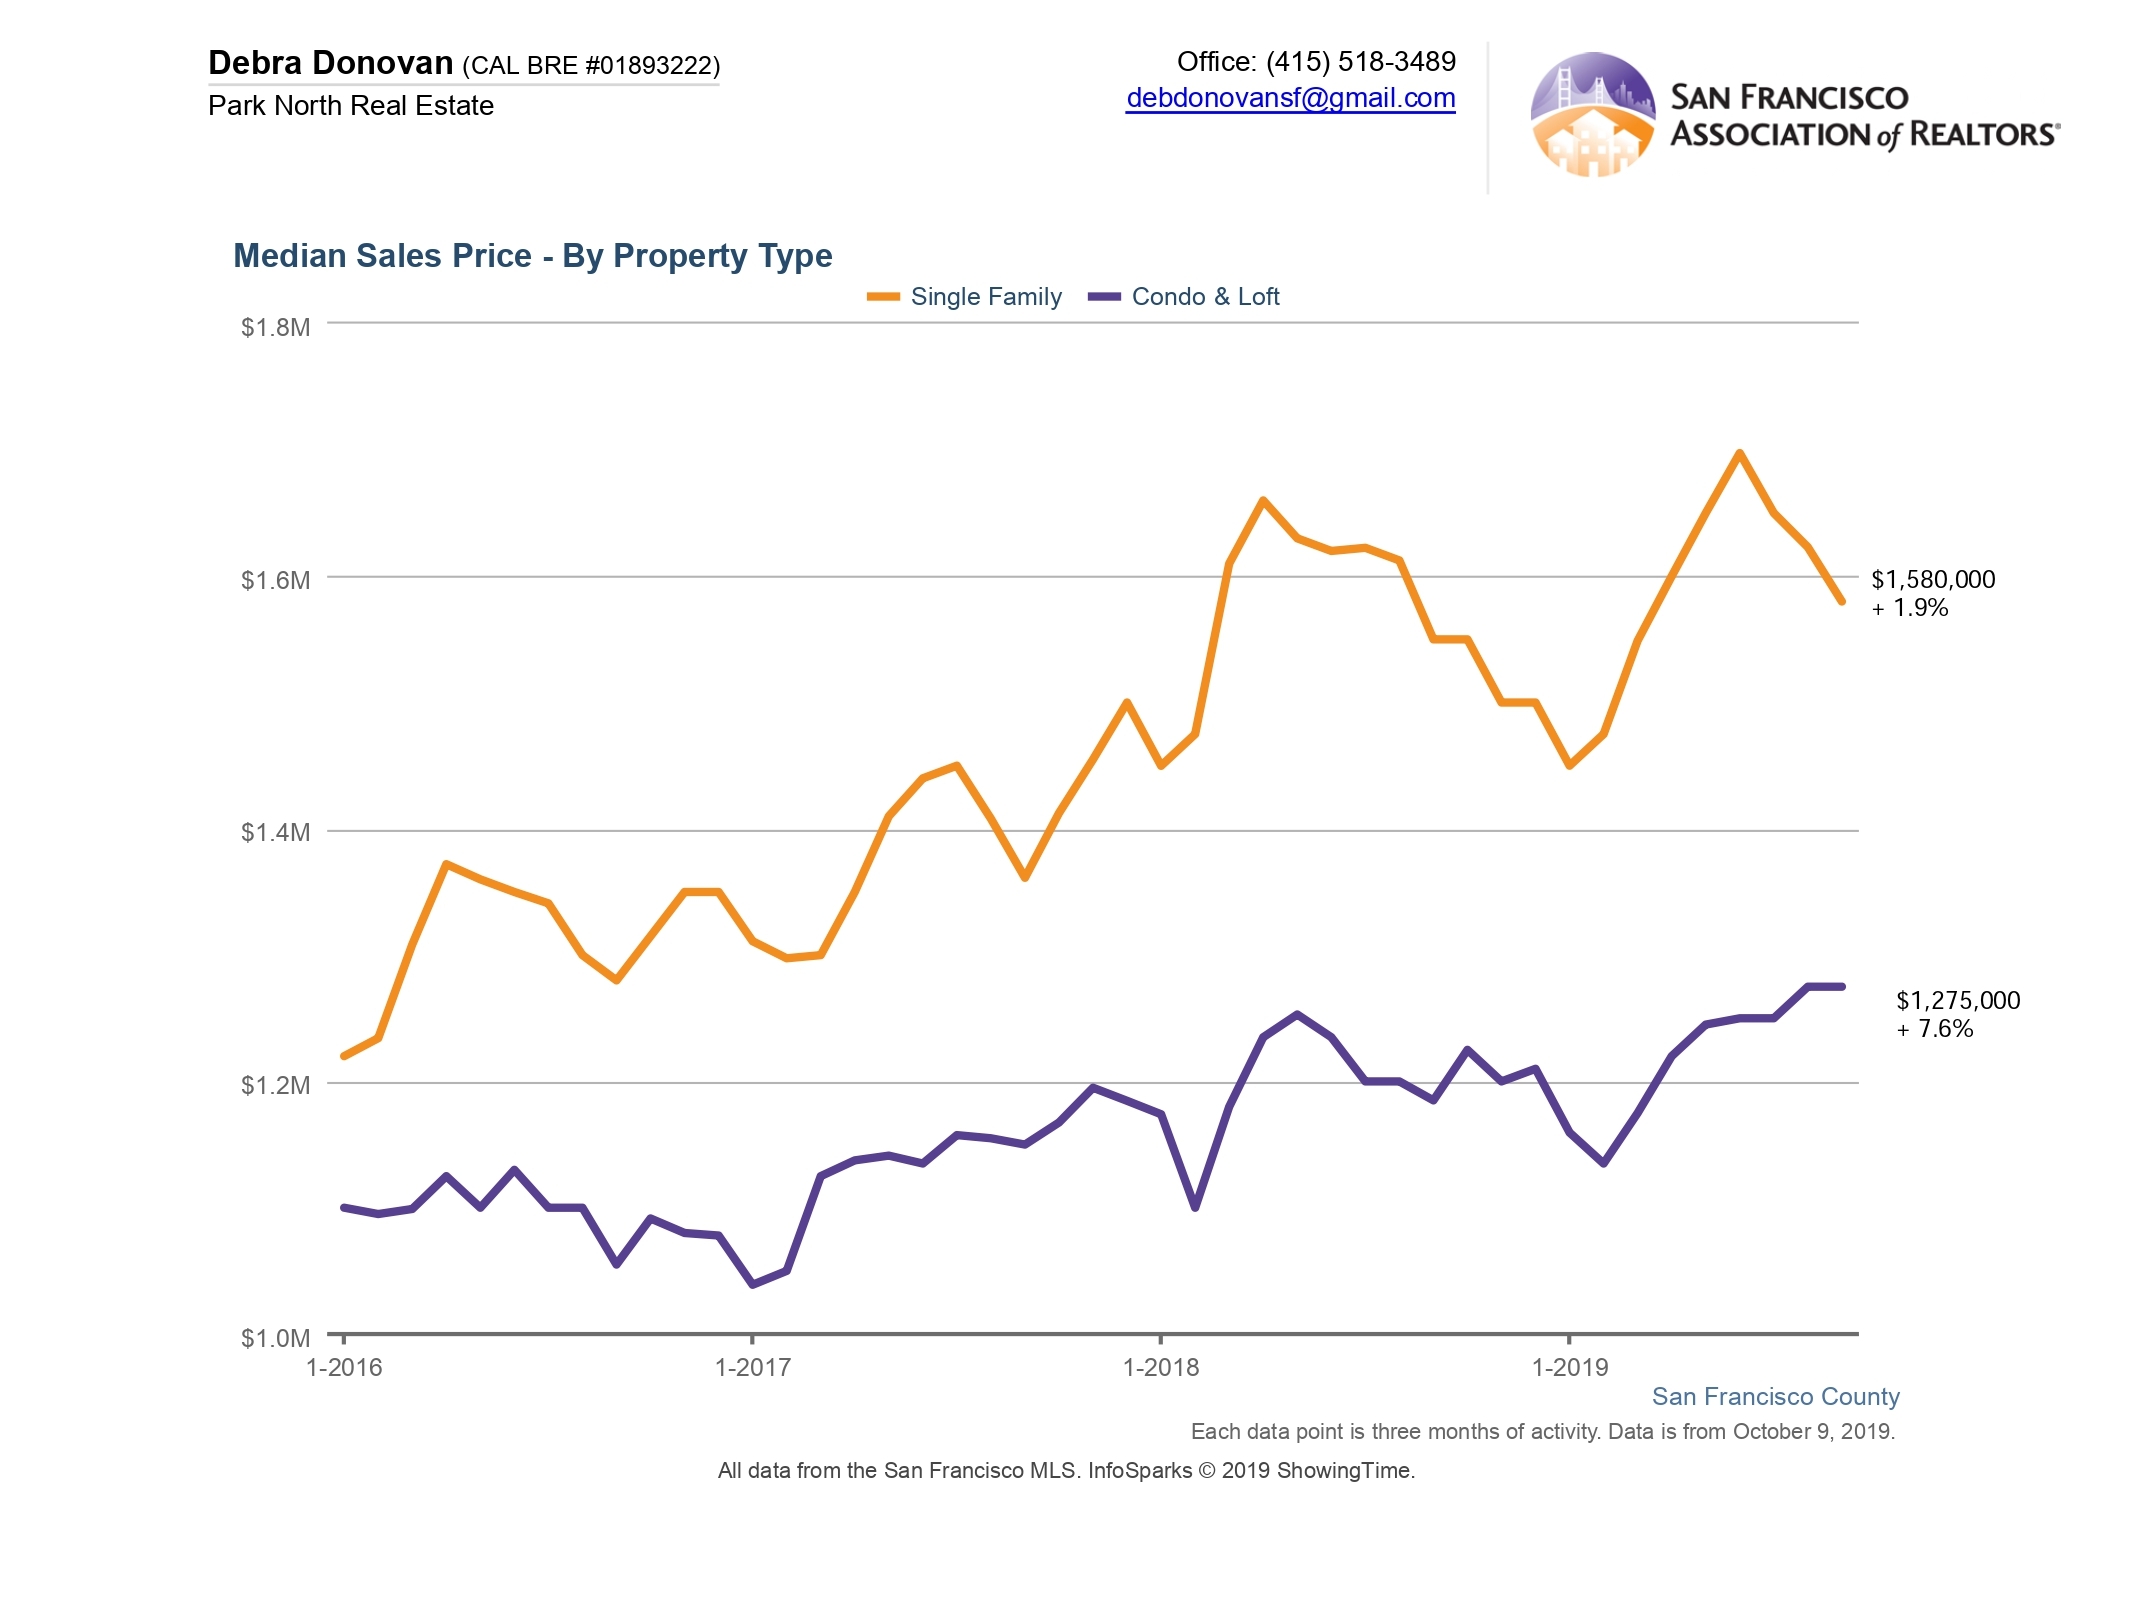
Home sales overall rose in July compared to the same month last year. The median sales price for a single family home was $1,660,000, up 5% compared to last year but down from June’s median sales price high of over $1.8 million. Condo and loft prices also rose year-over-year in July, increasing 4% to $1,275,000. This is also up compared to June of this year.
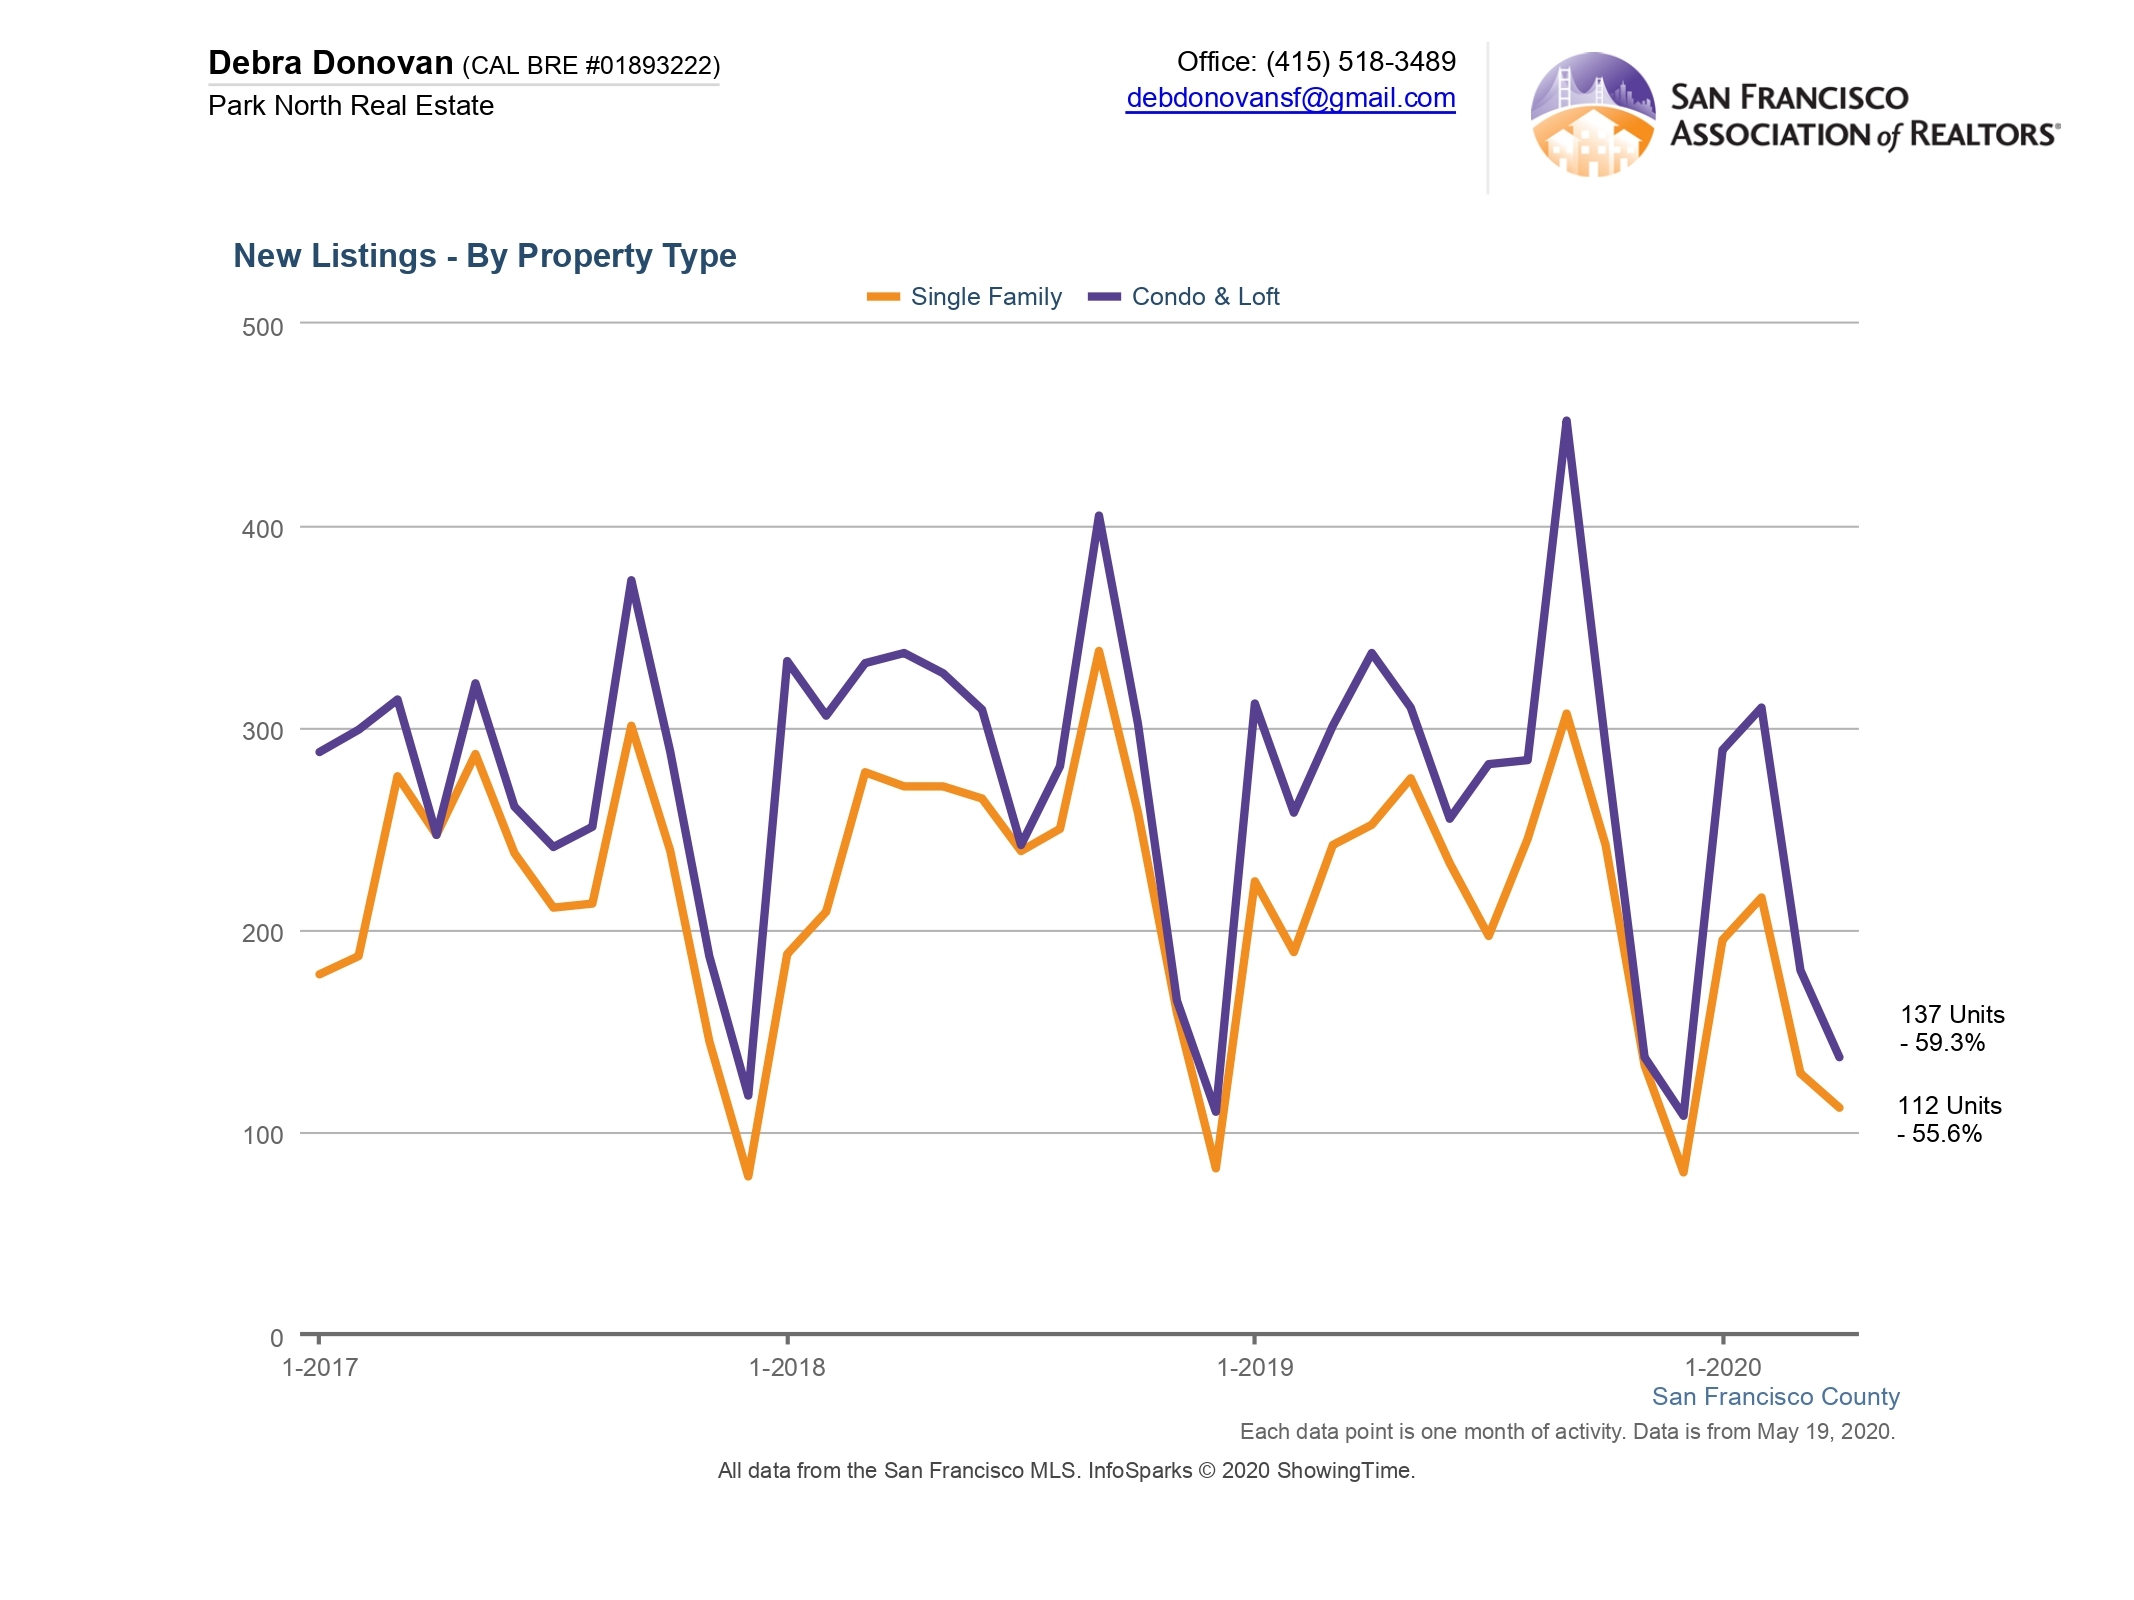
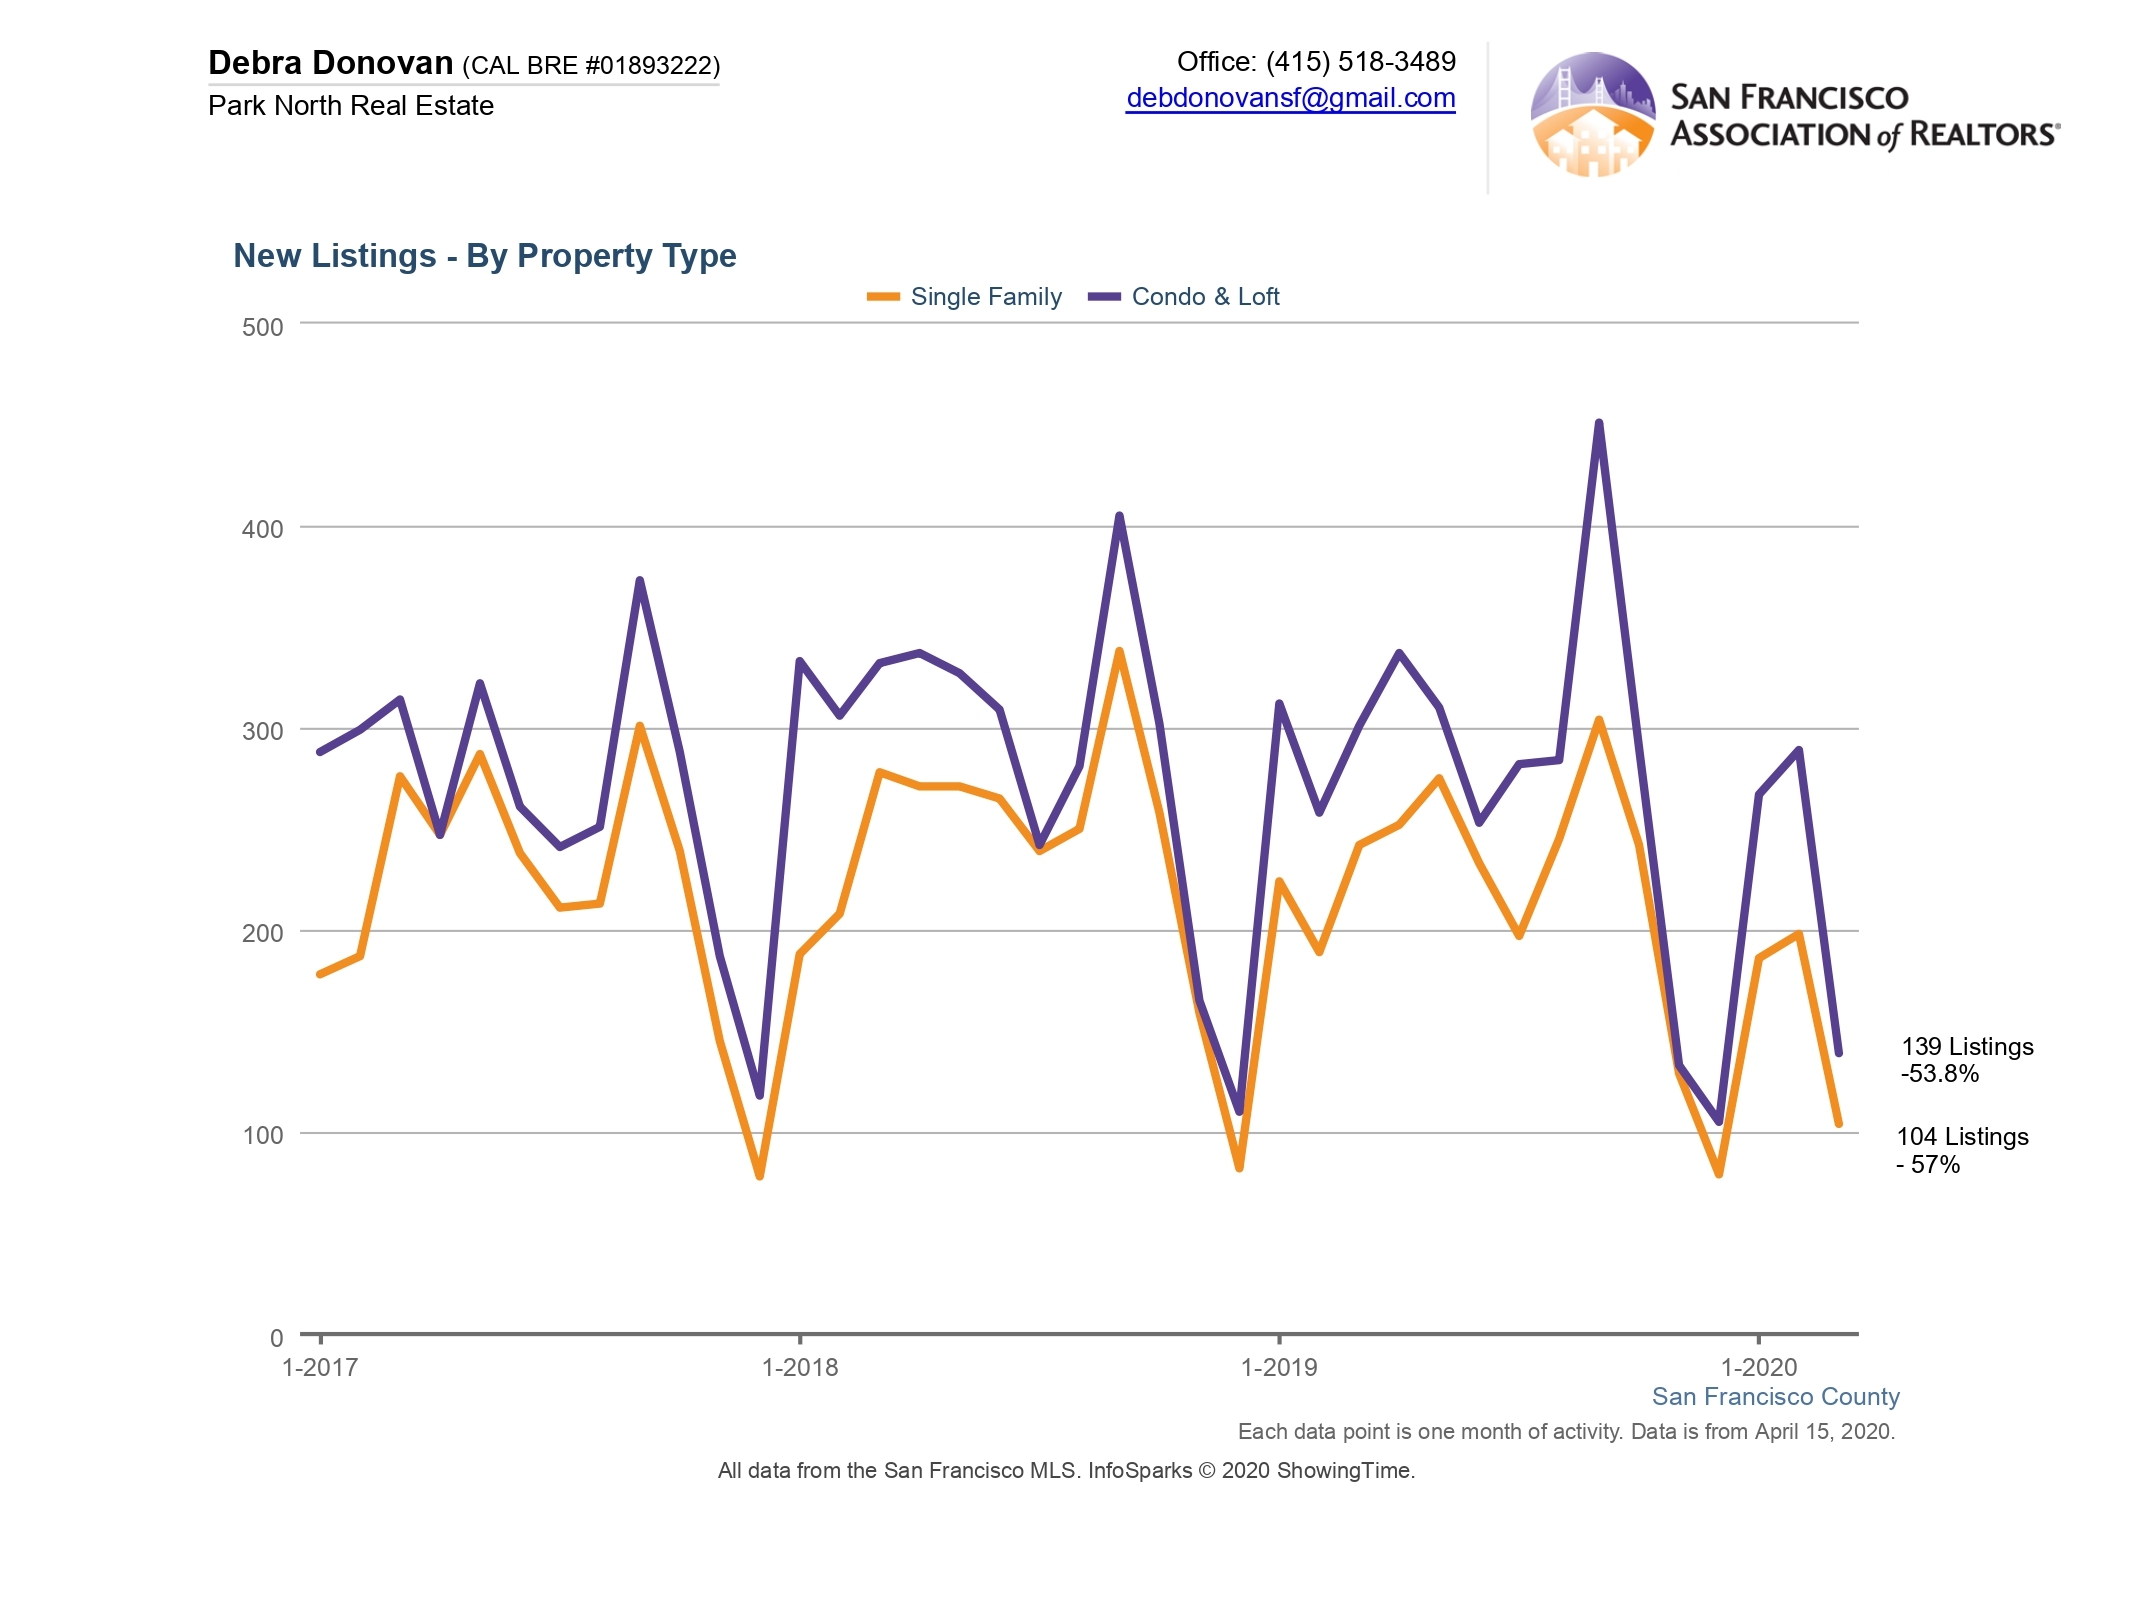
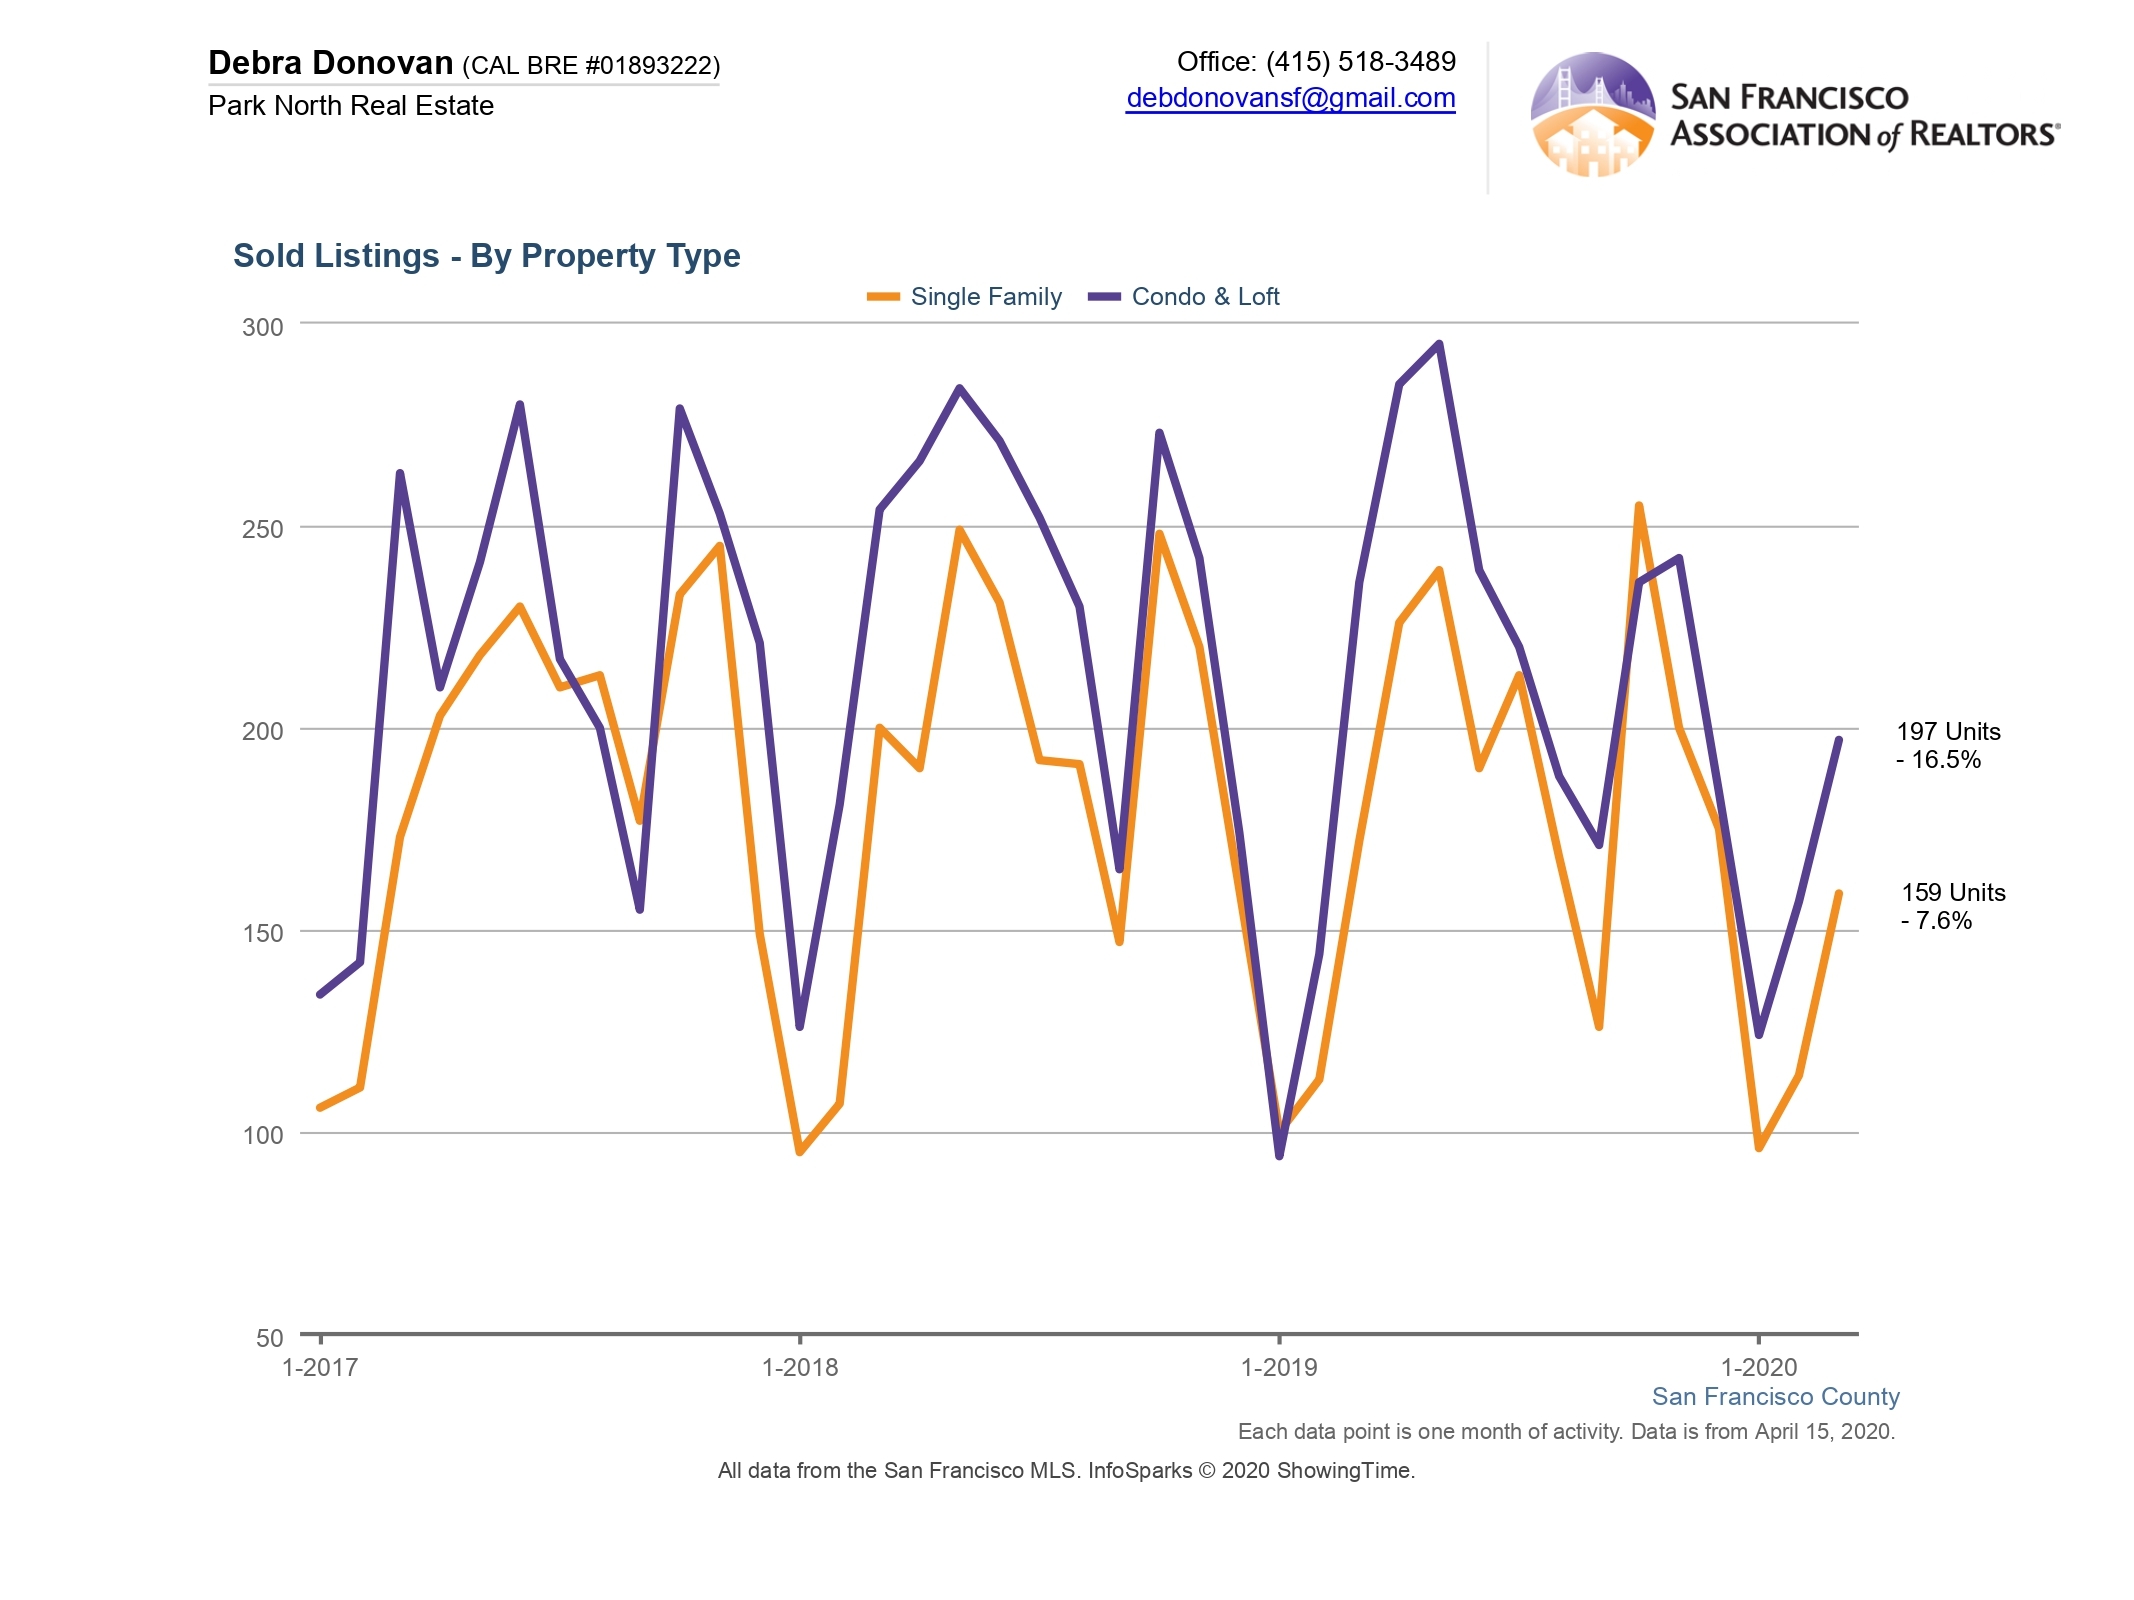
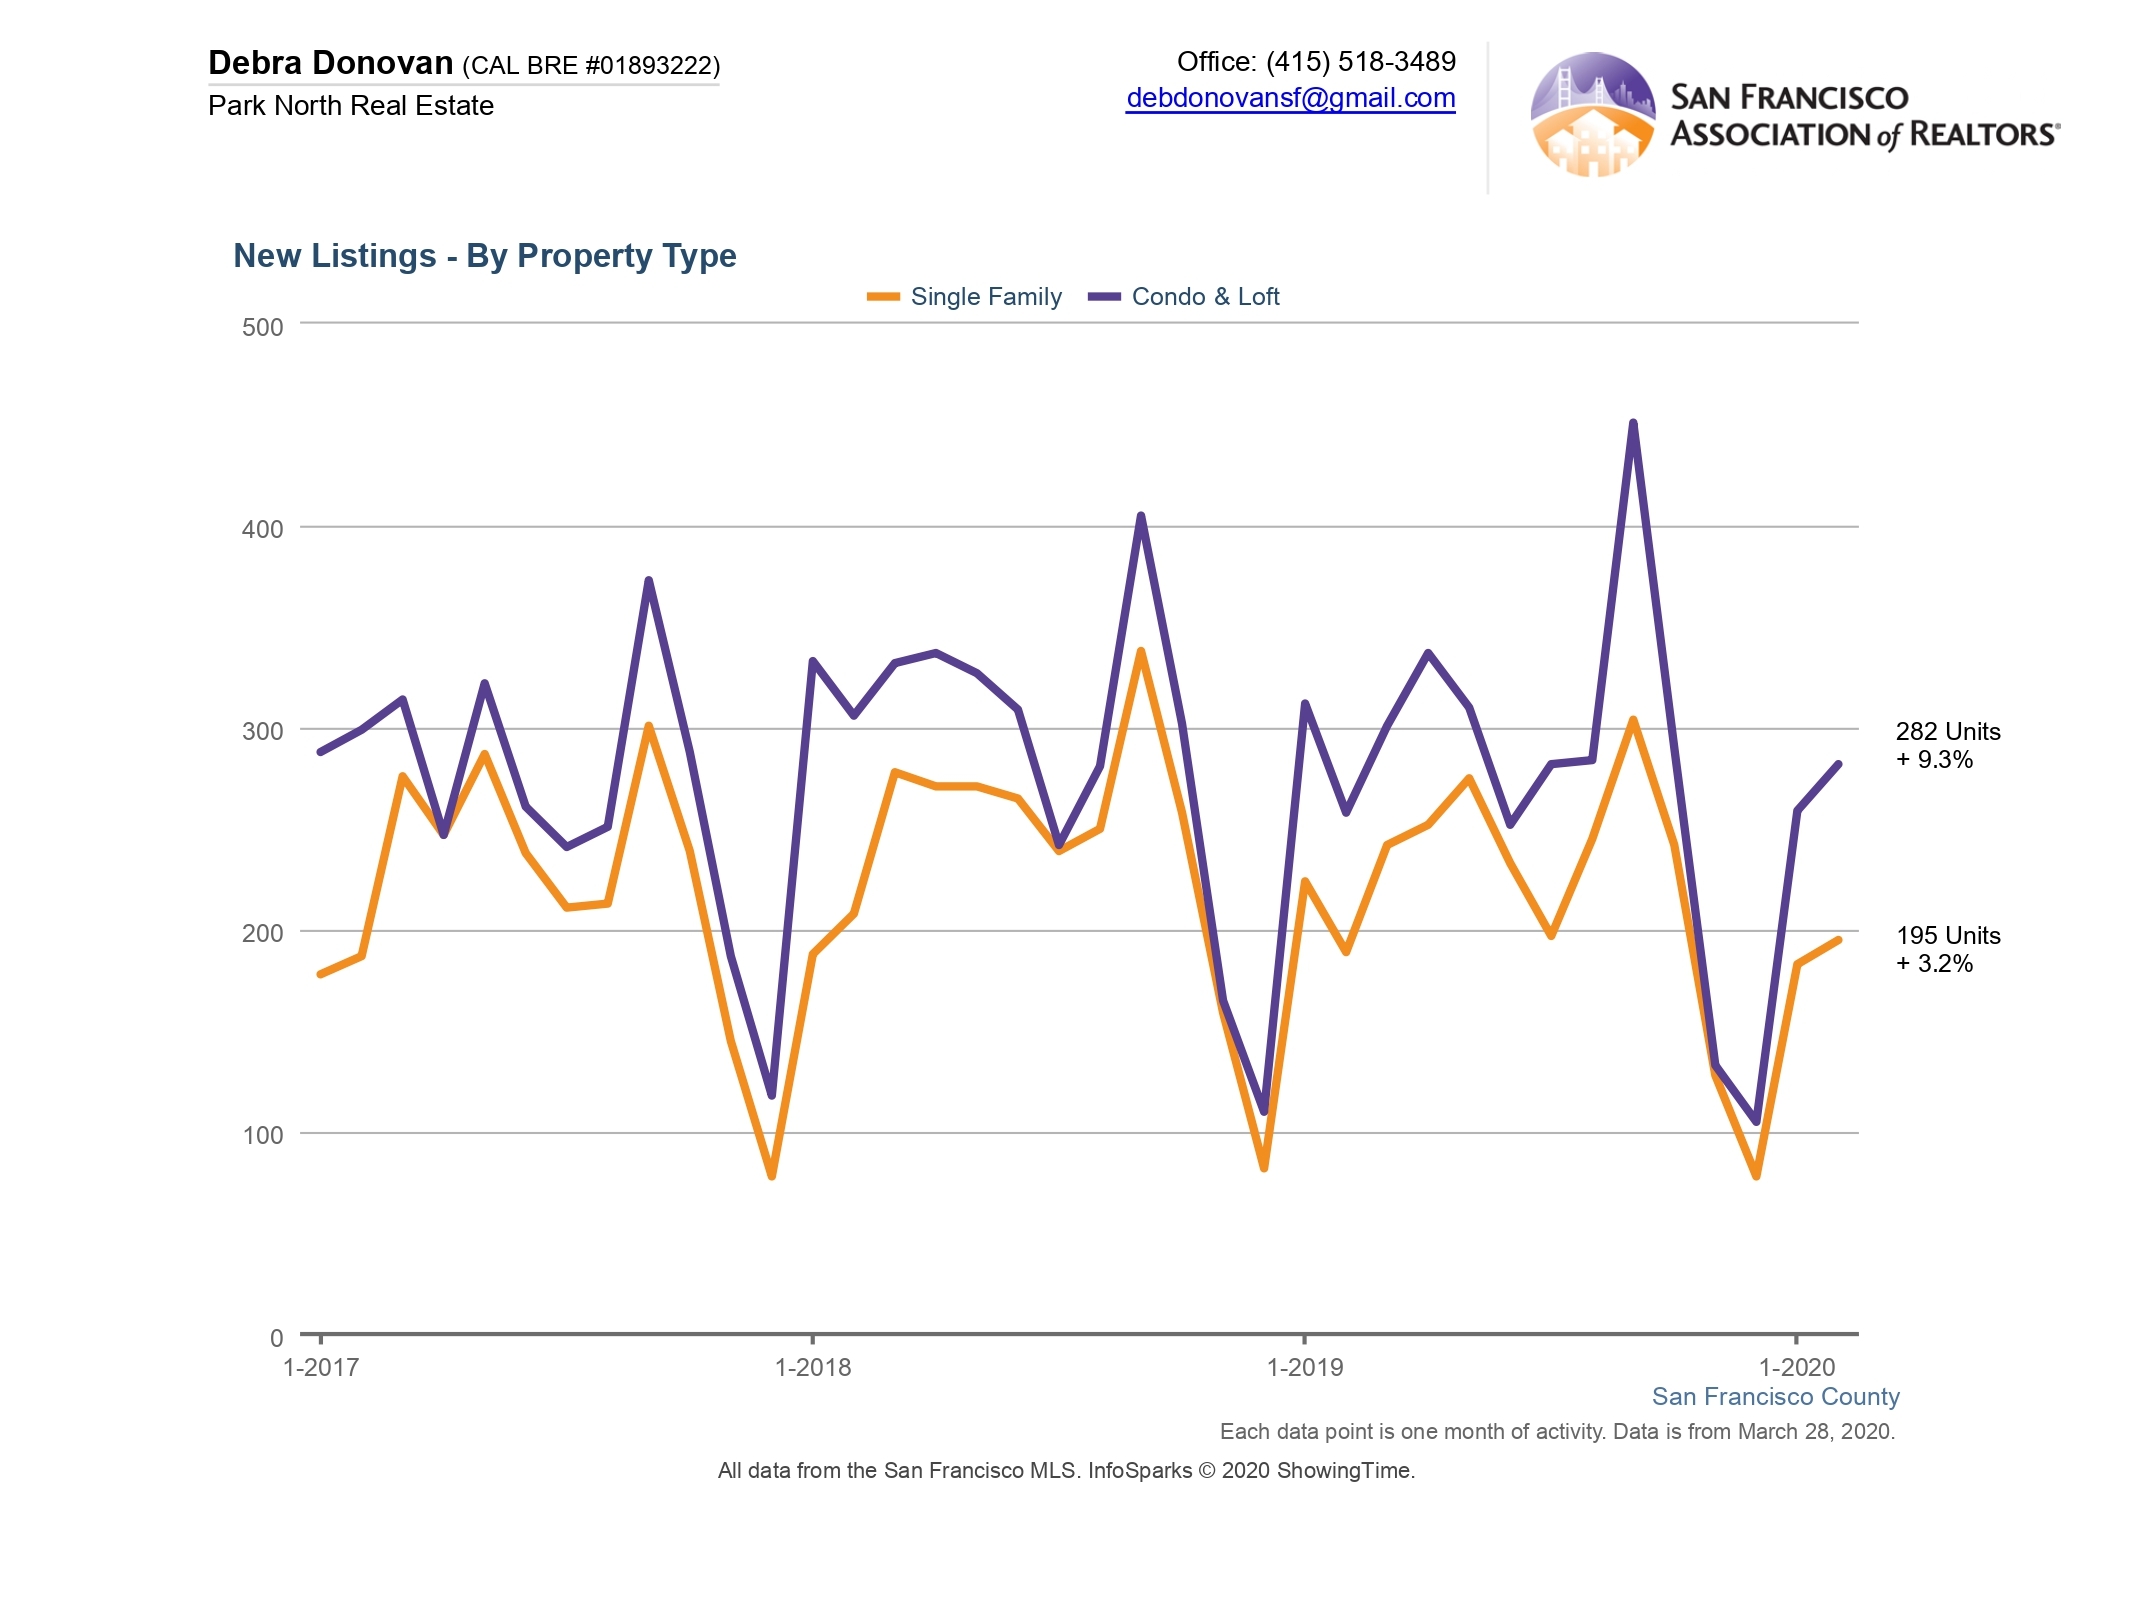
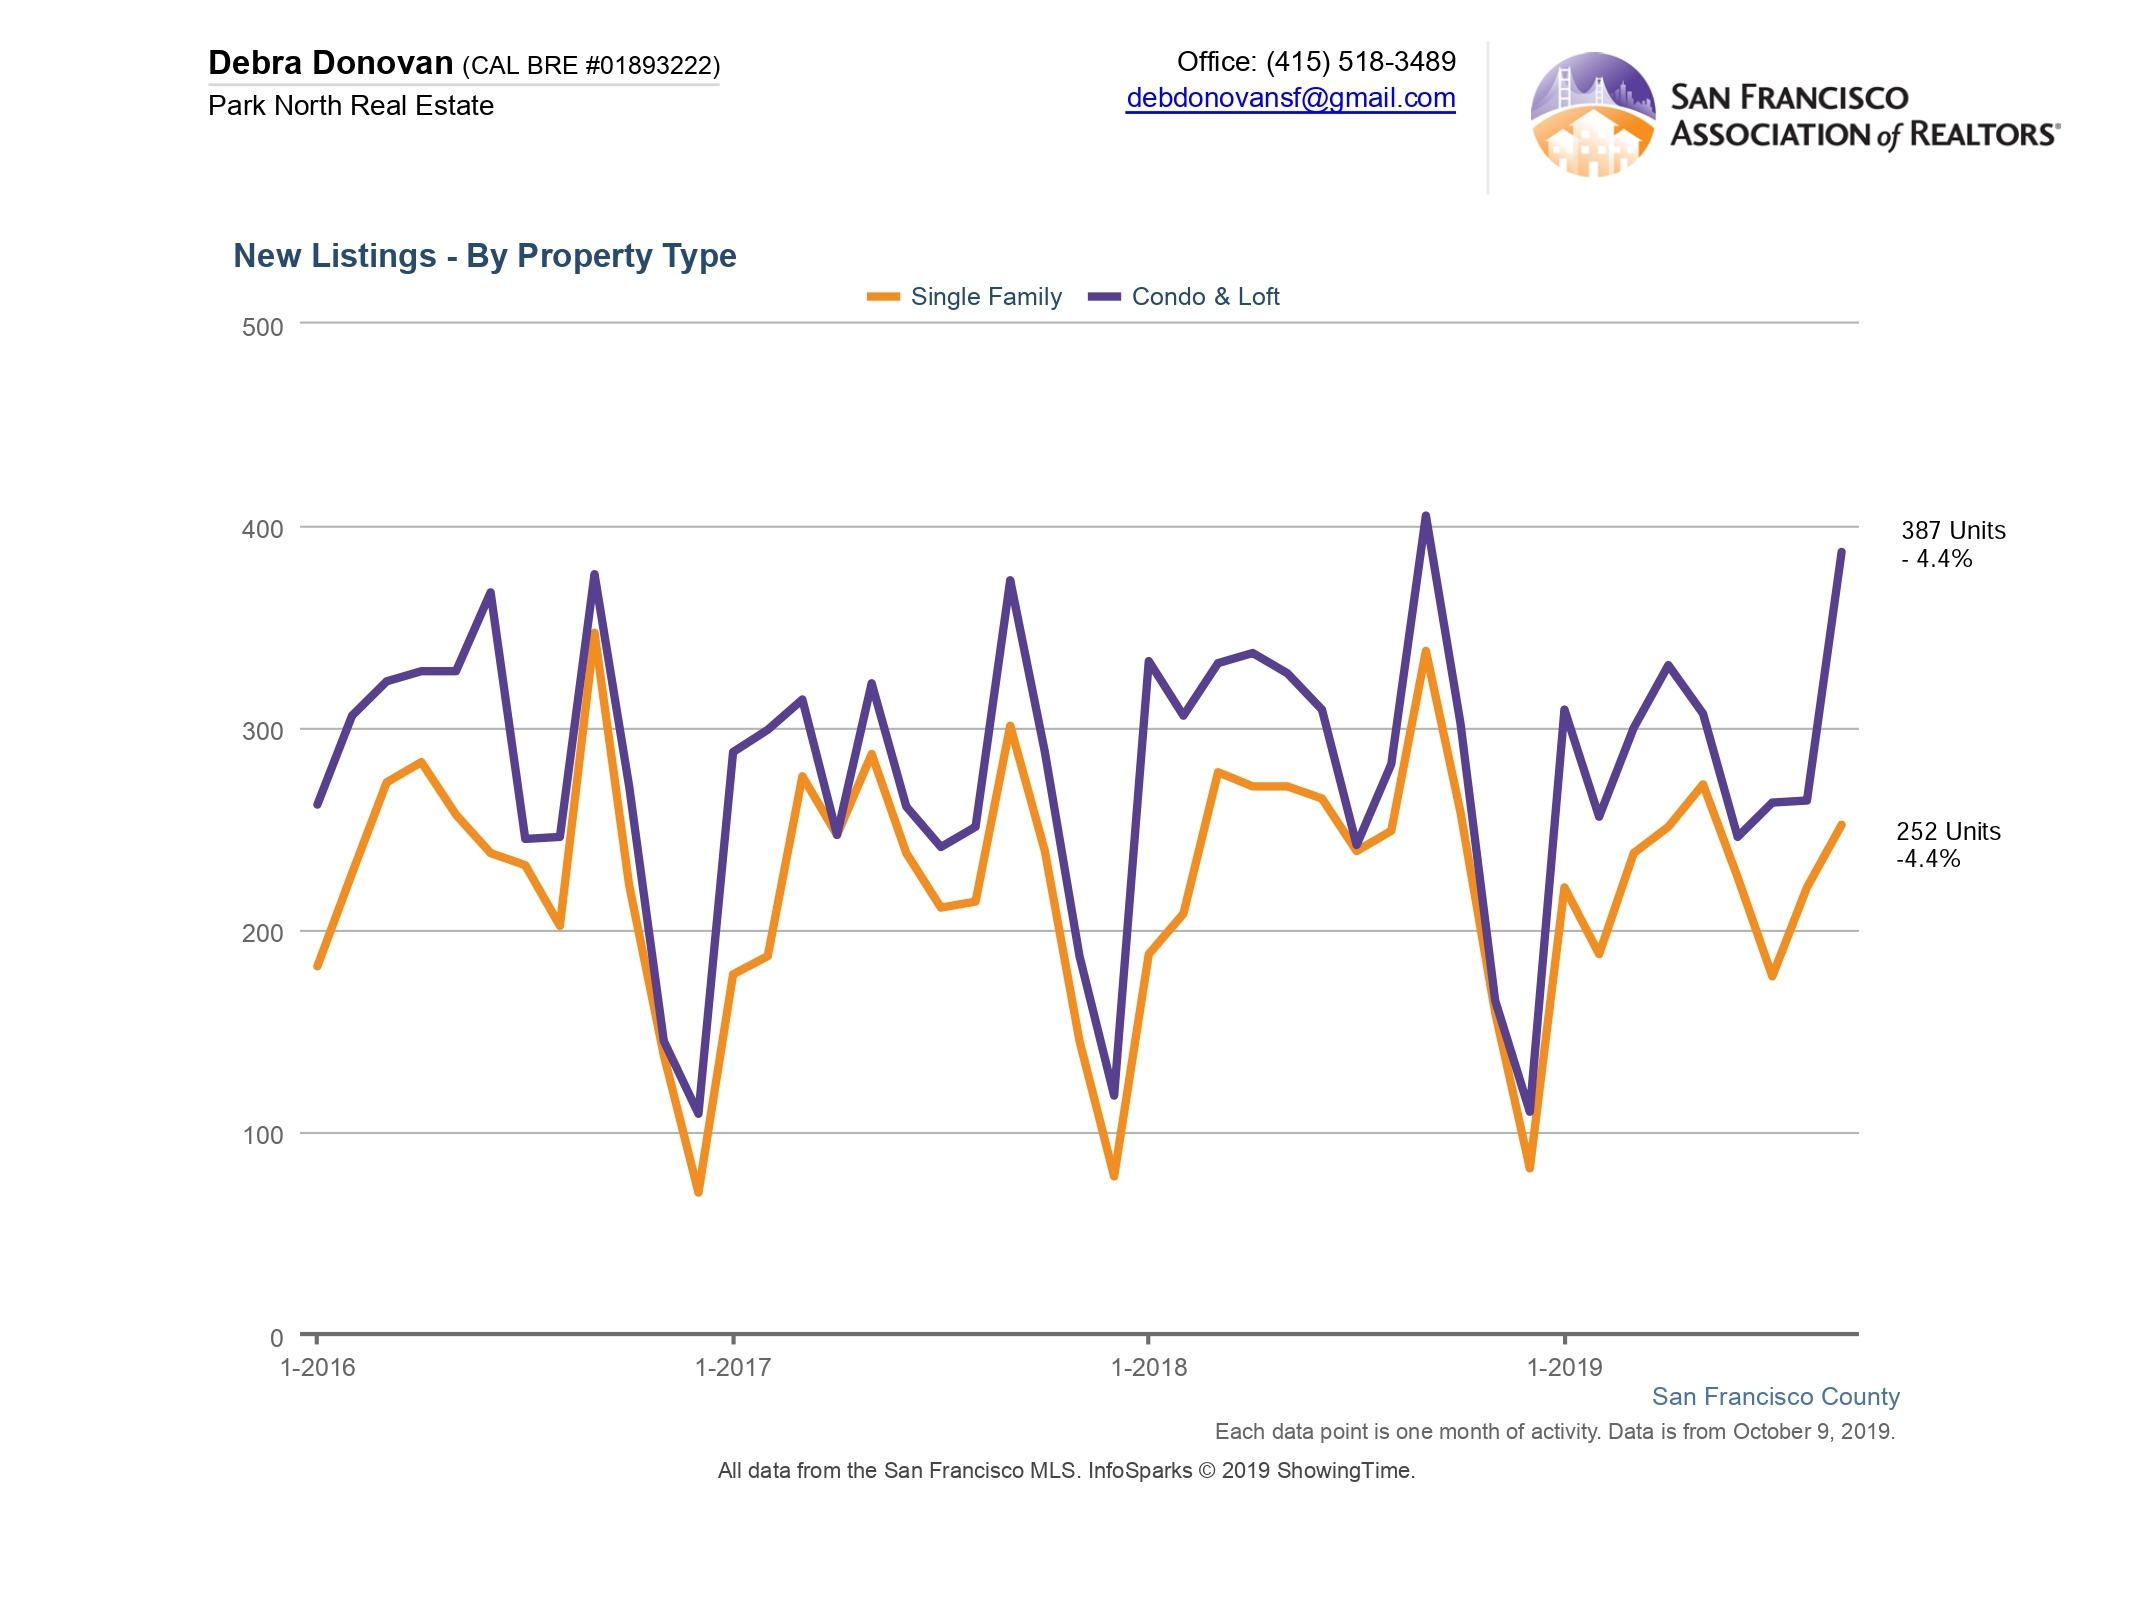
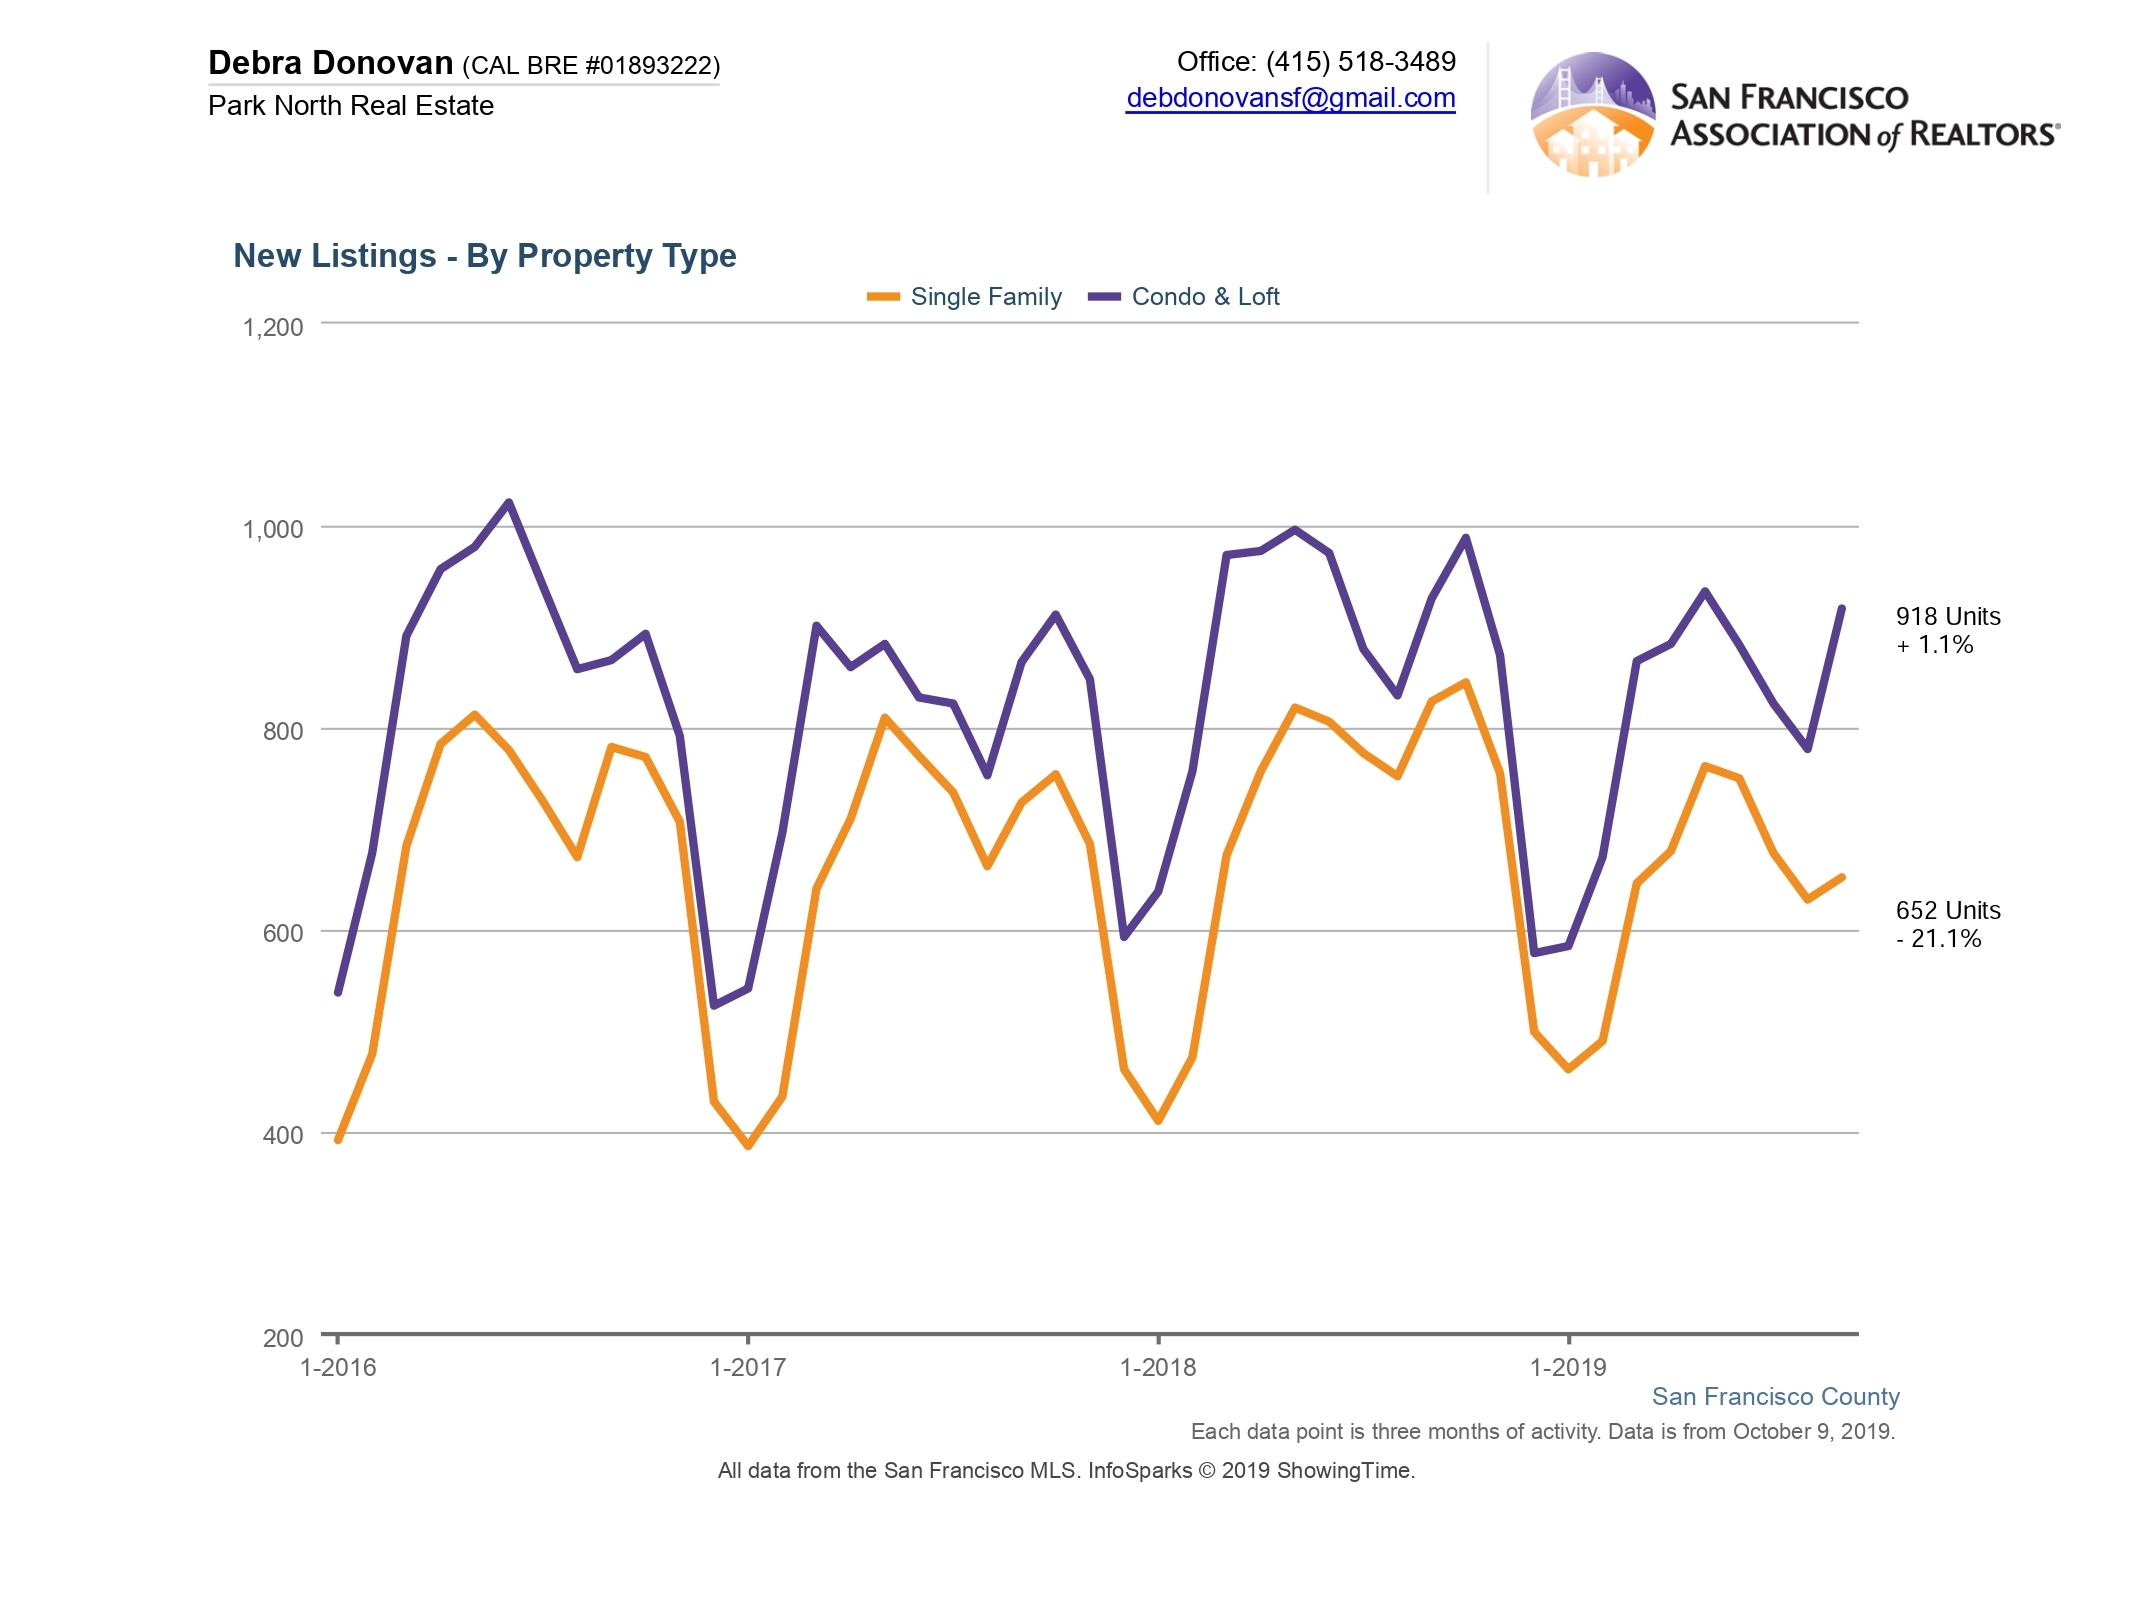
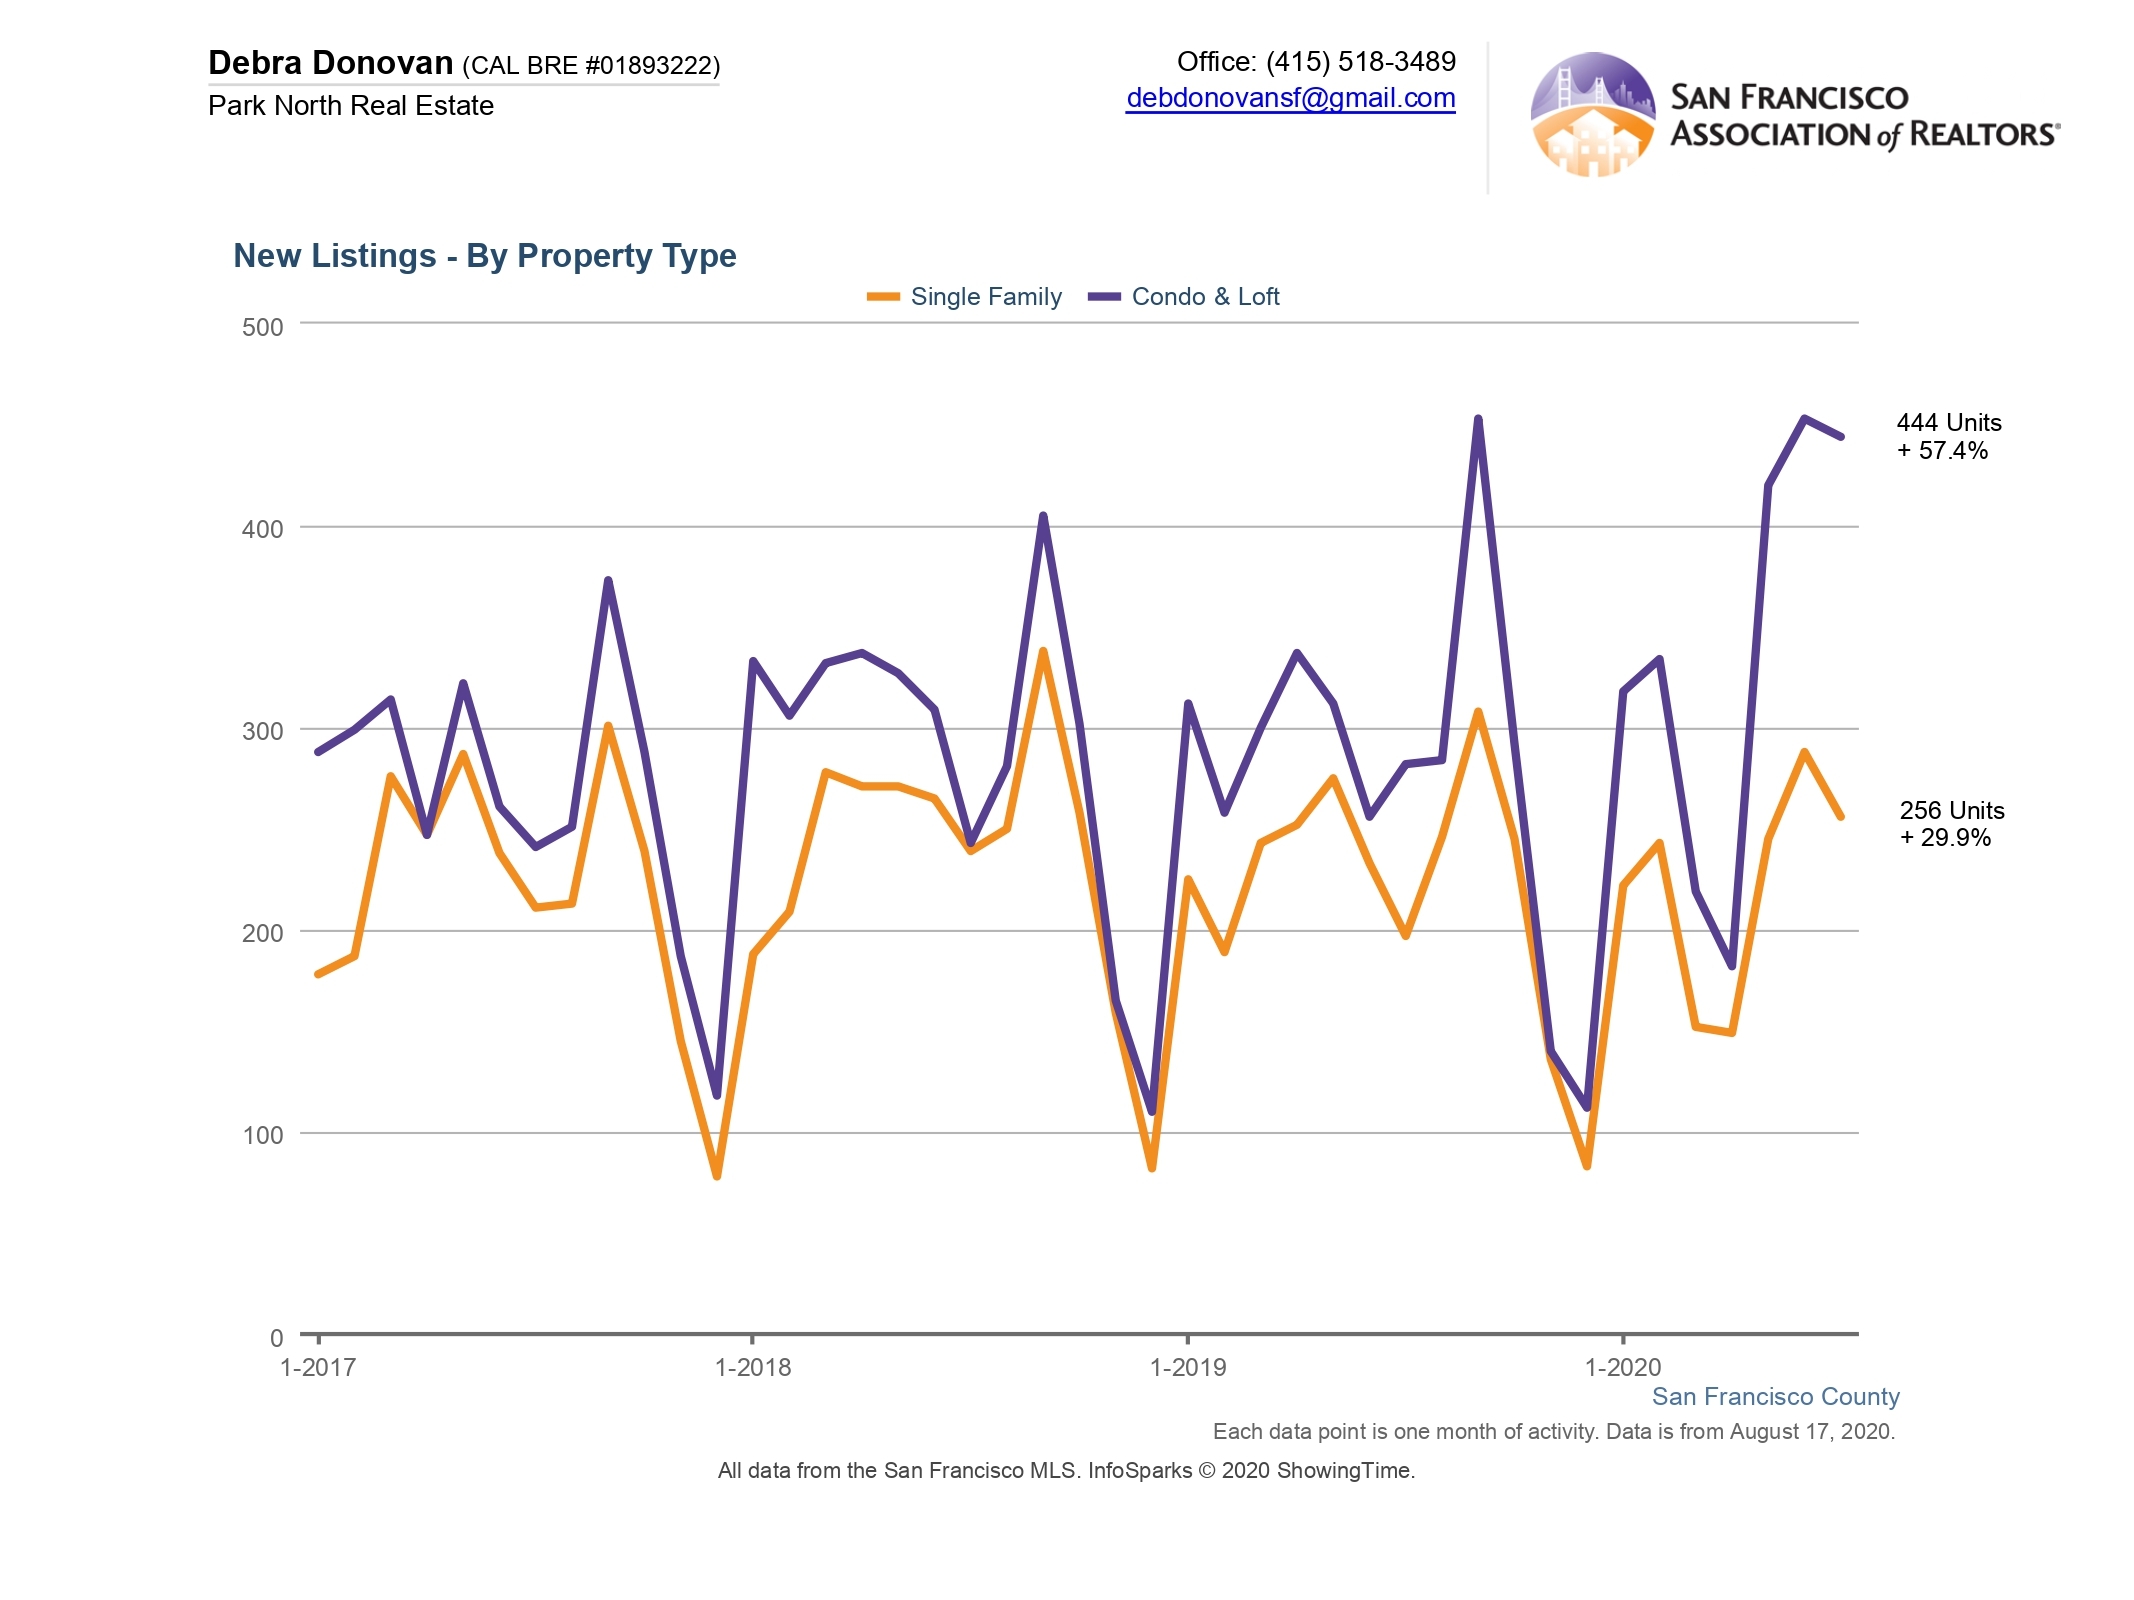
New Listings:
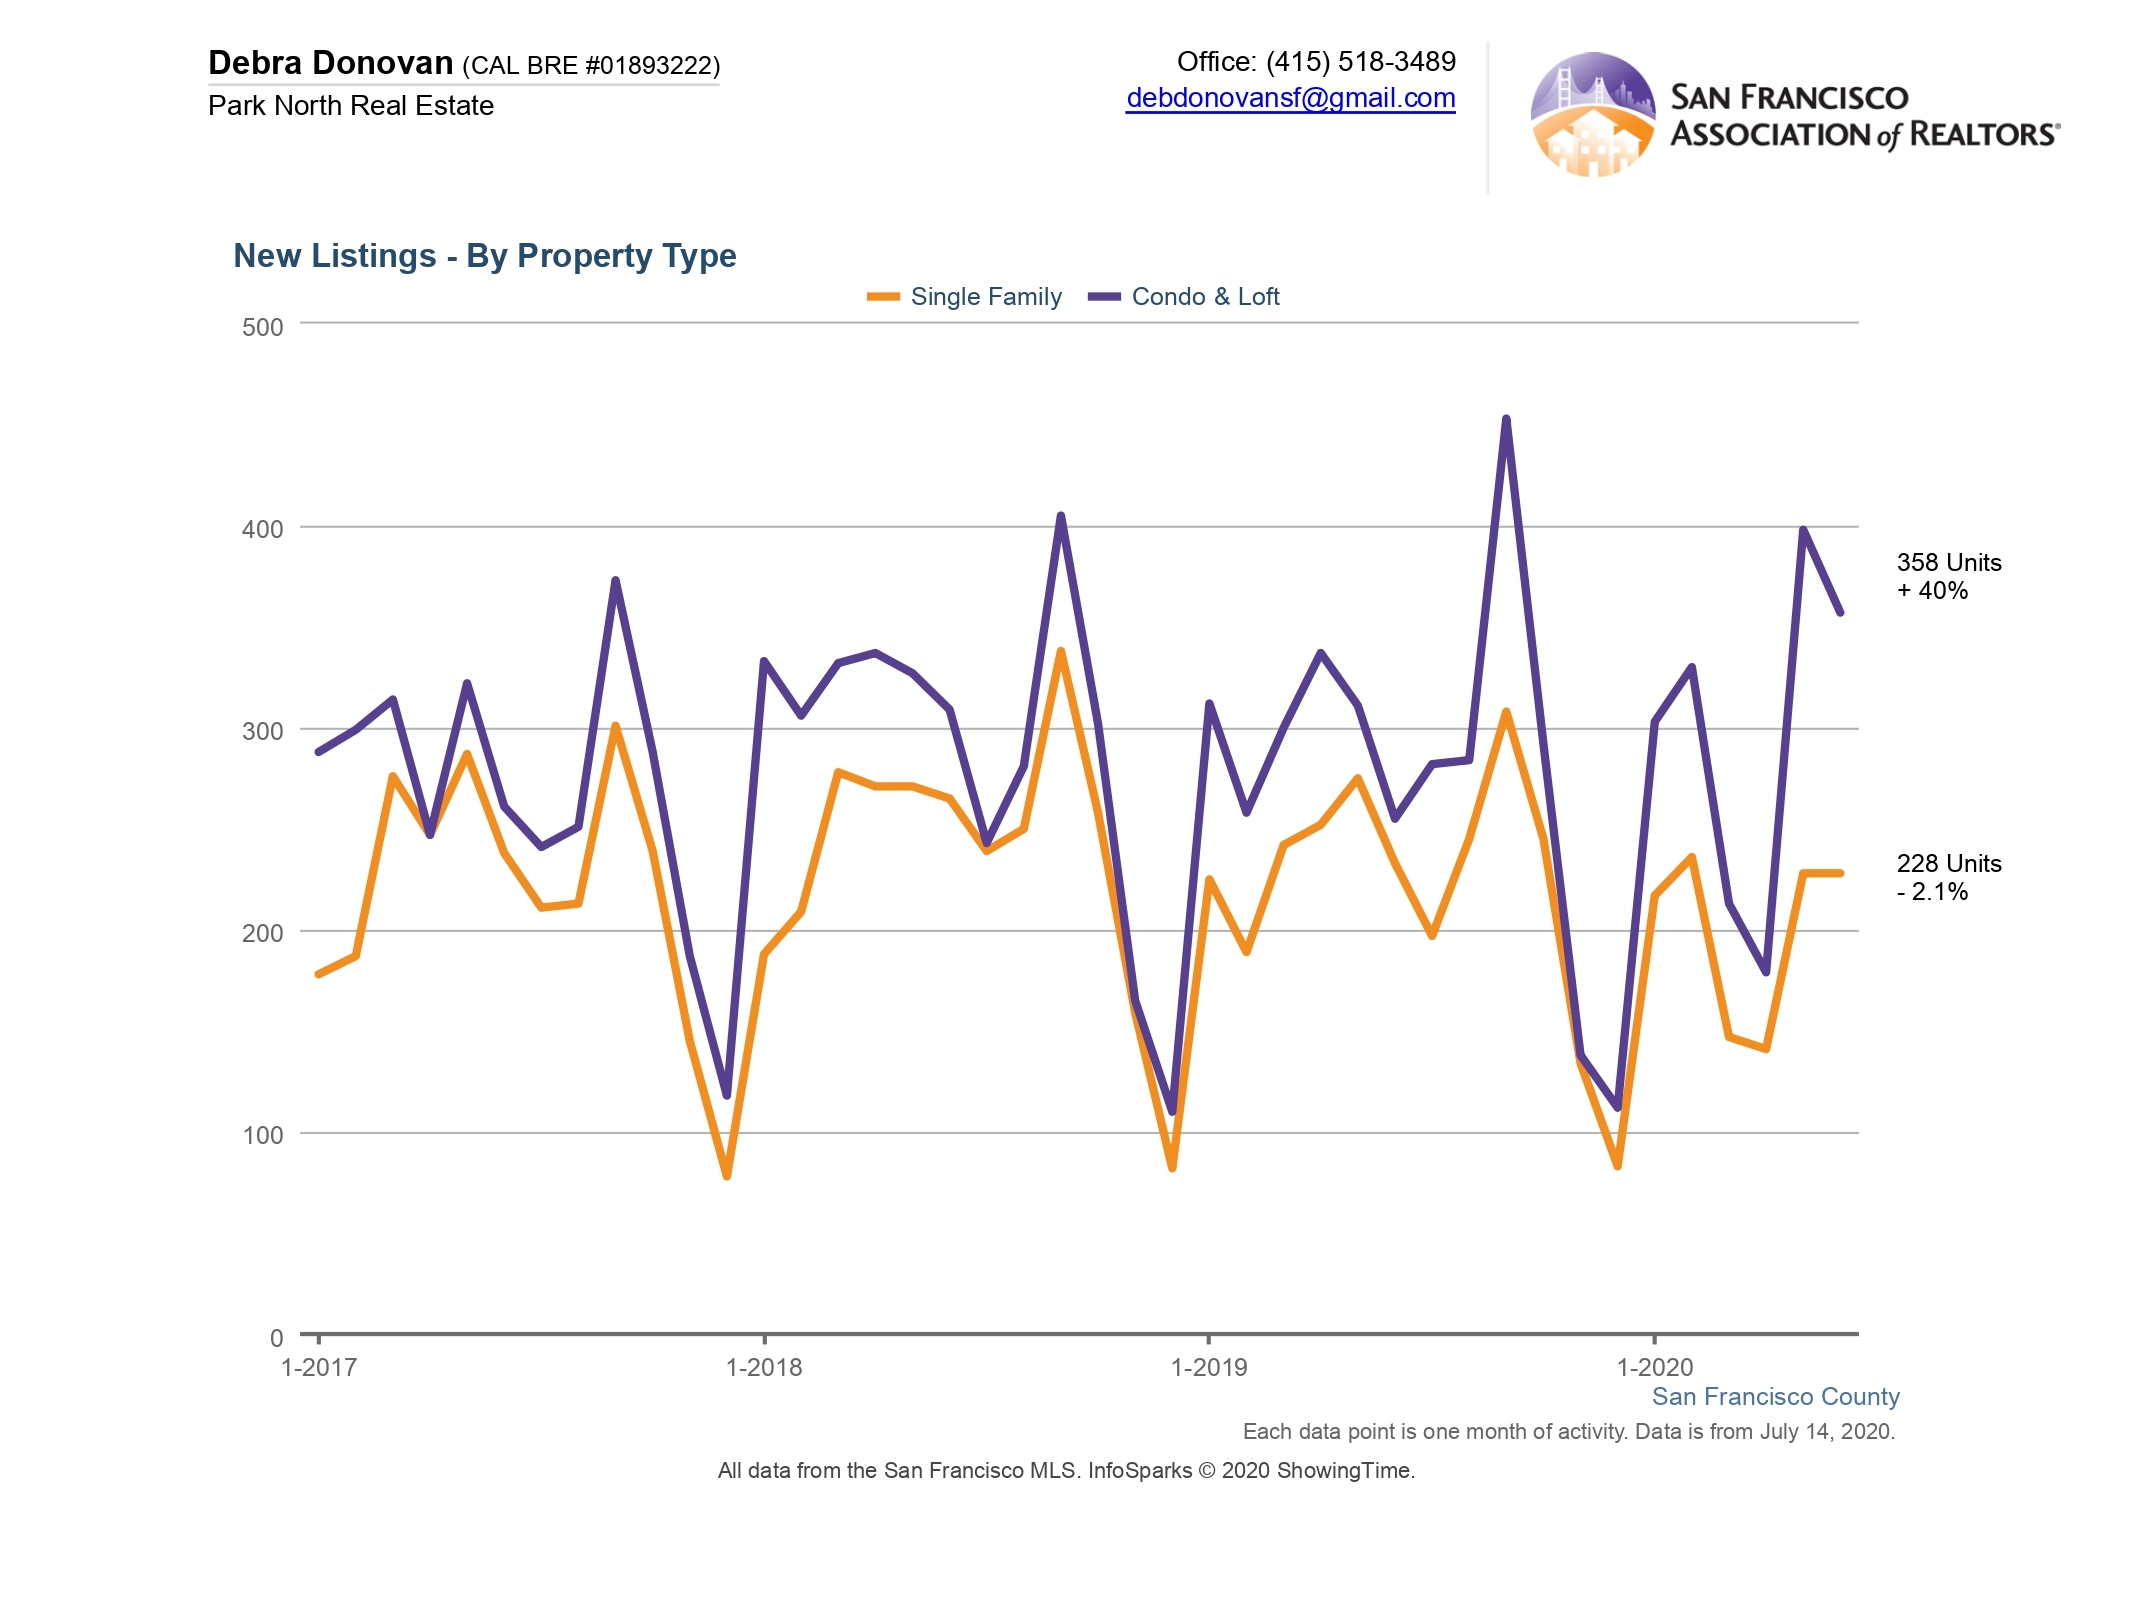
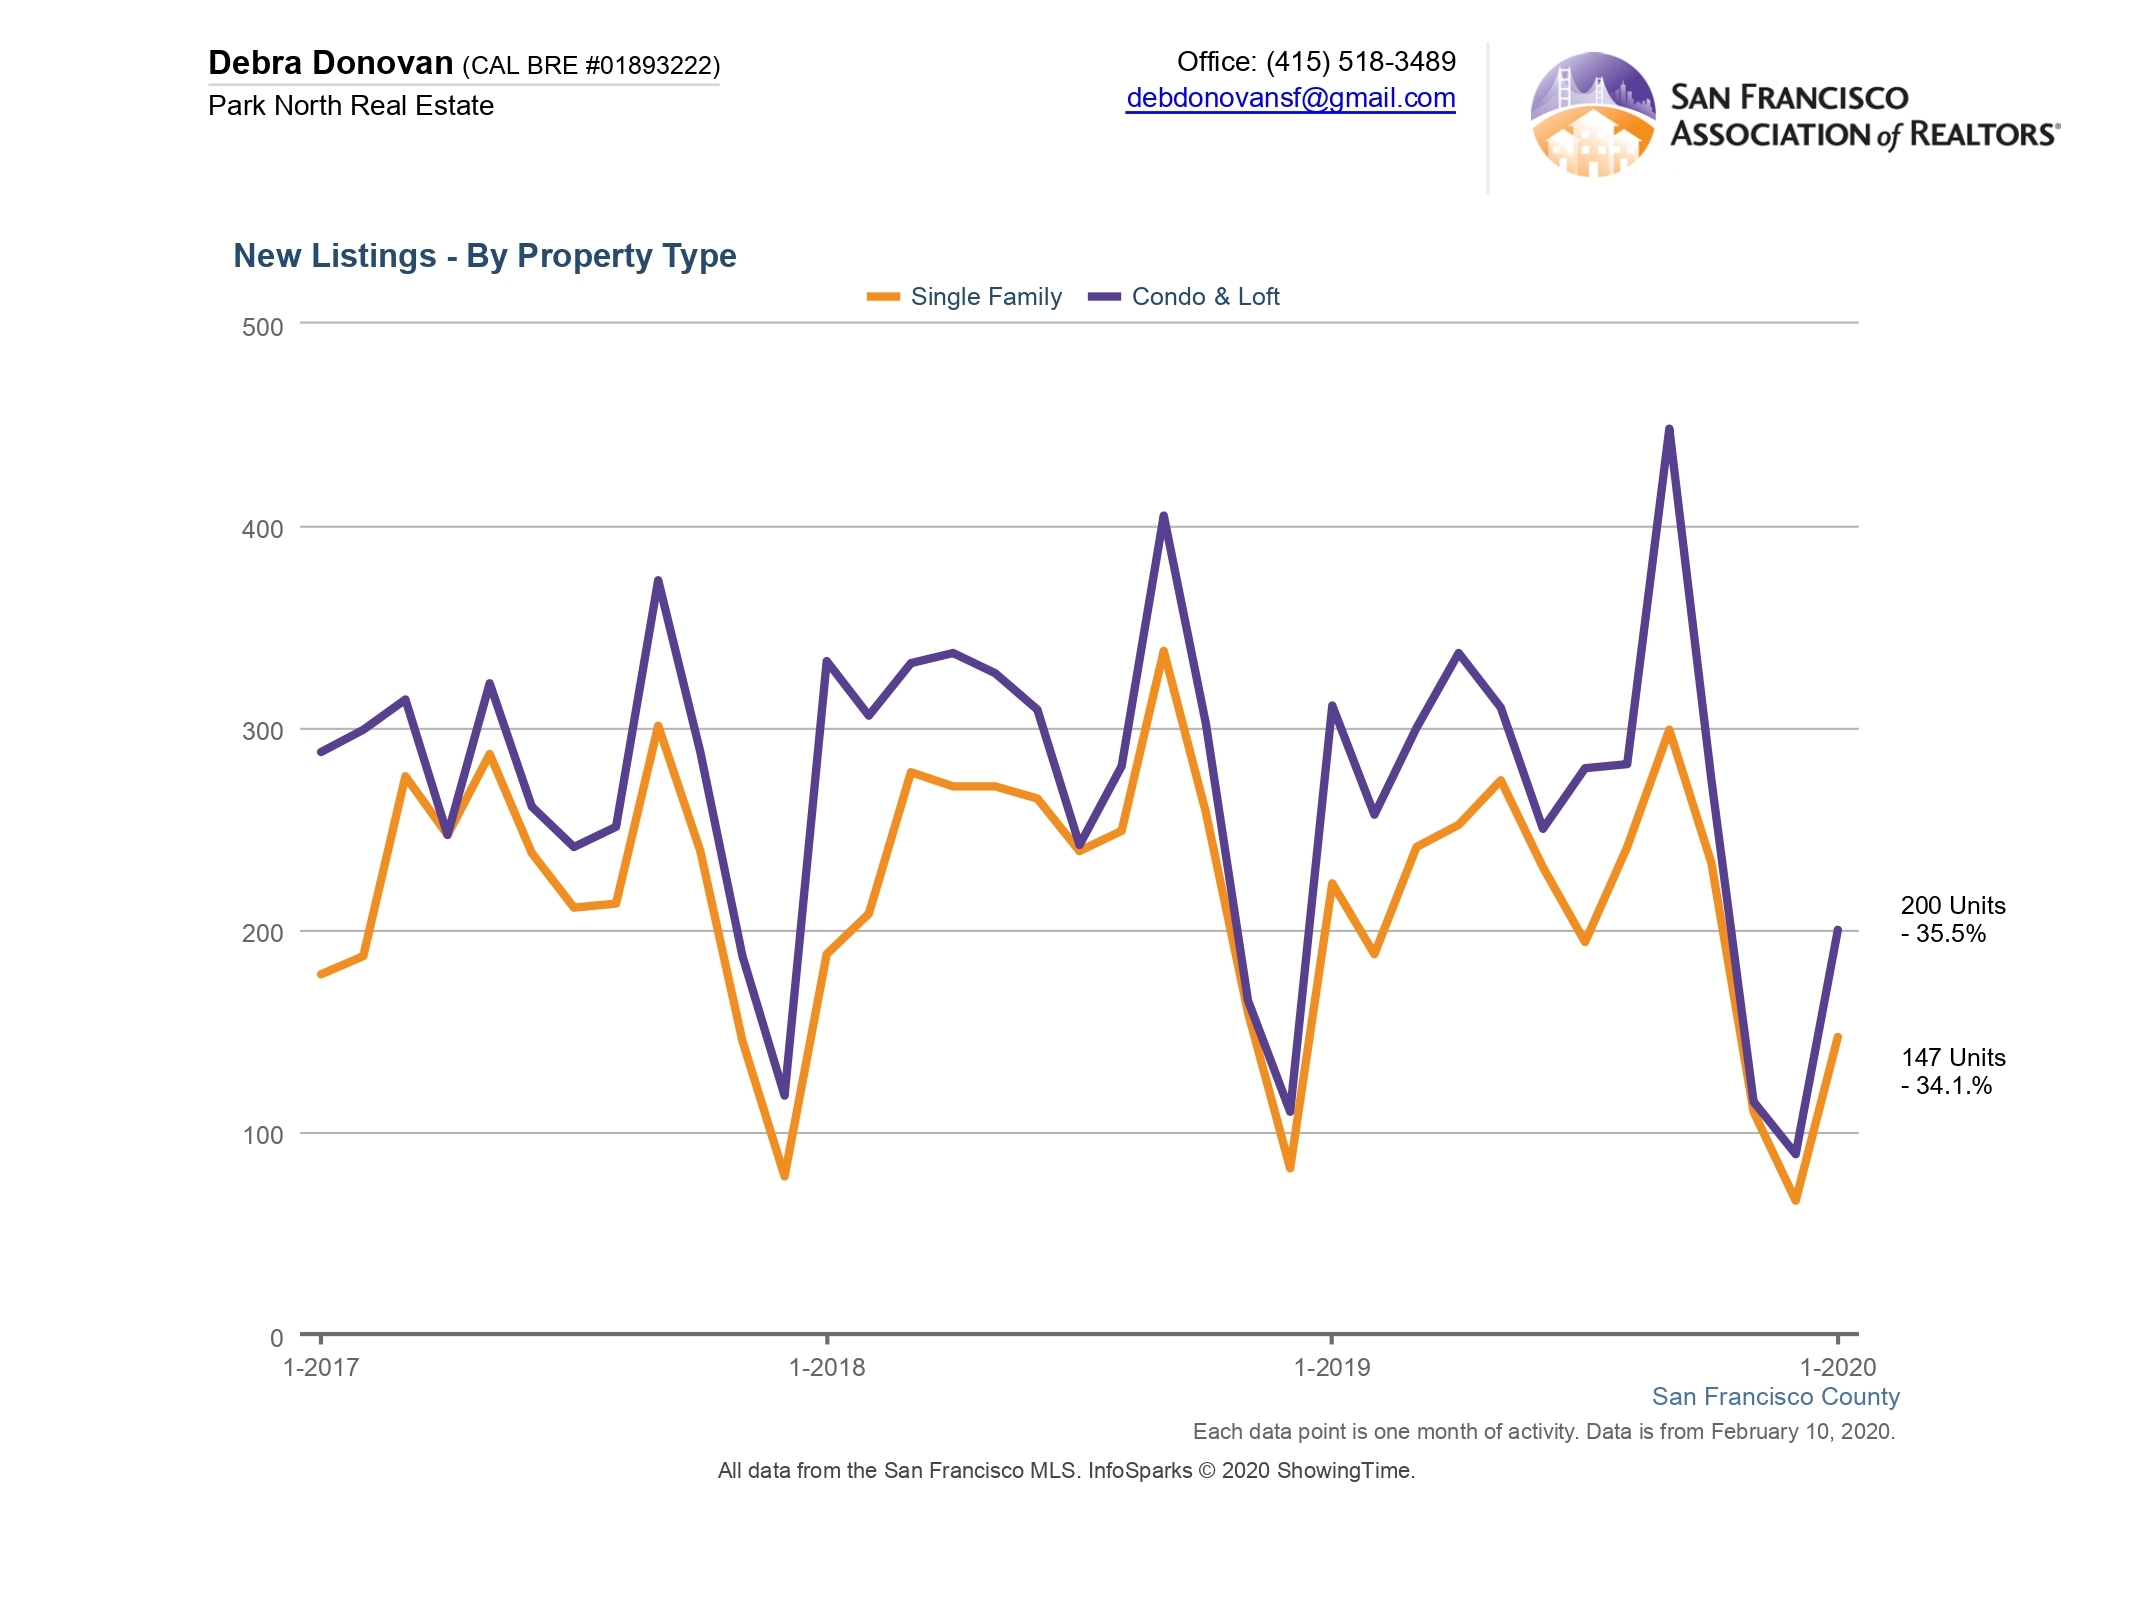
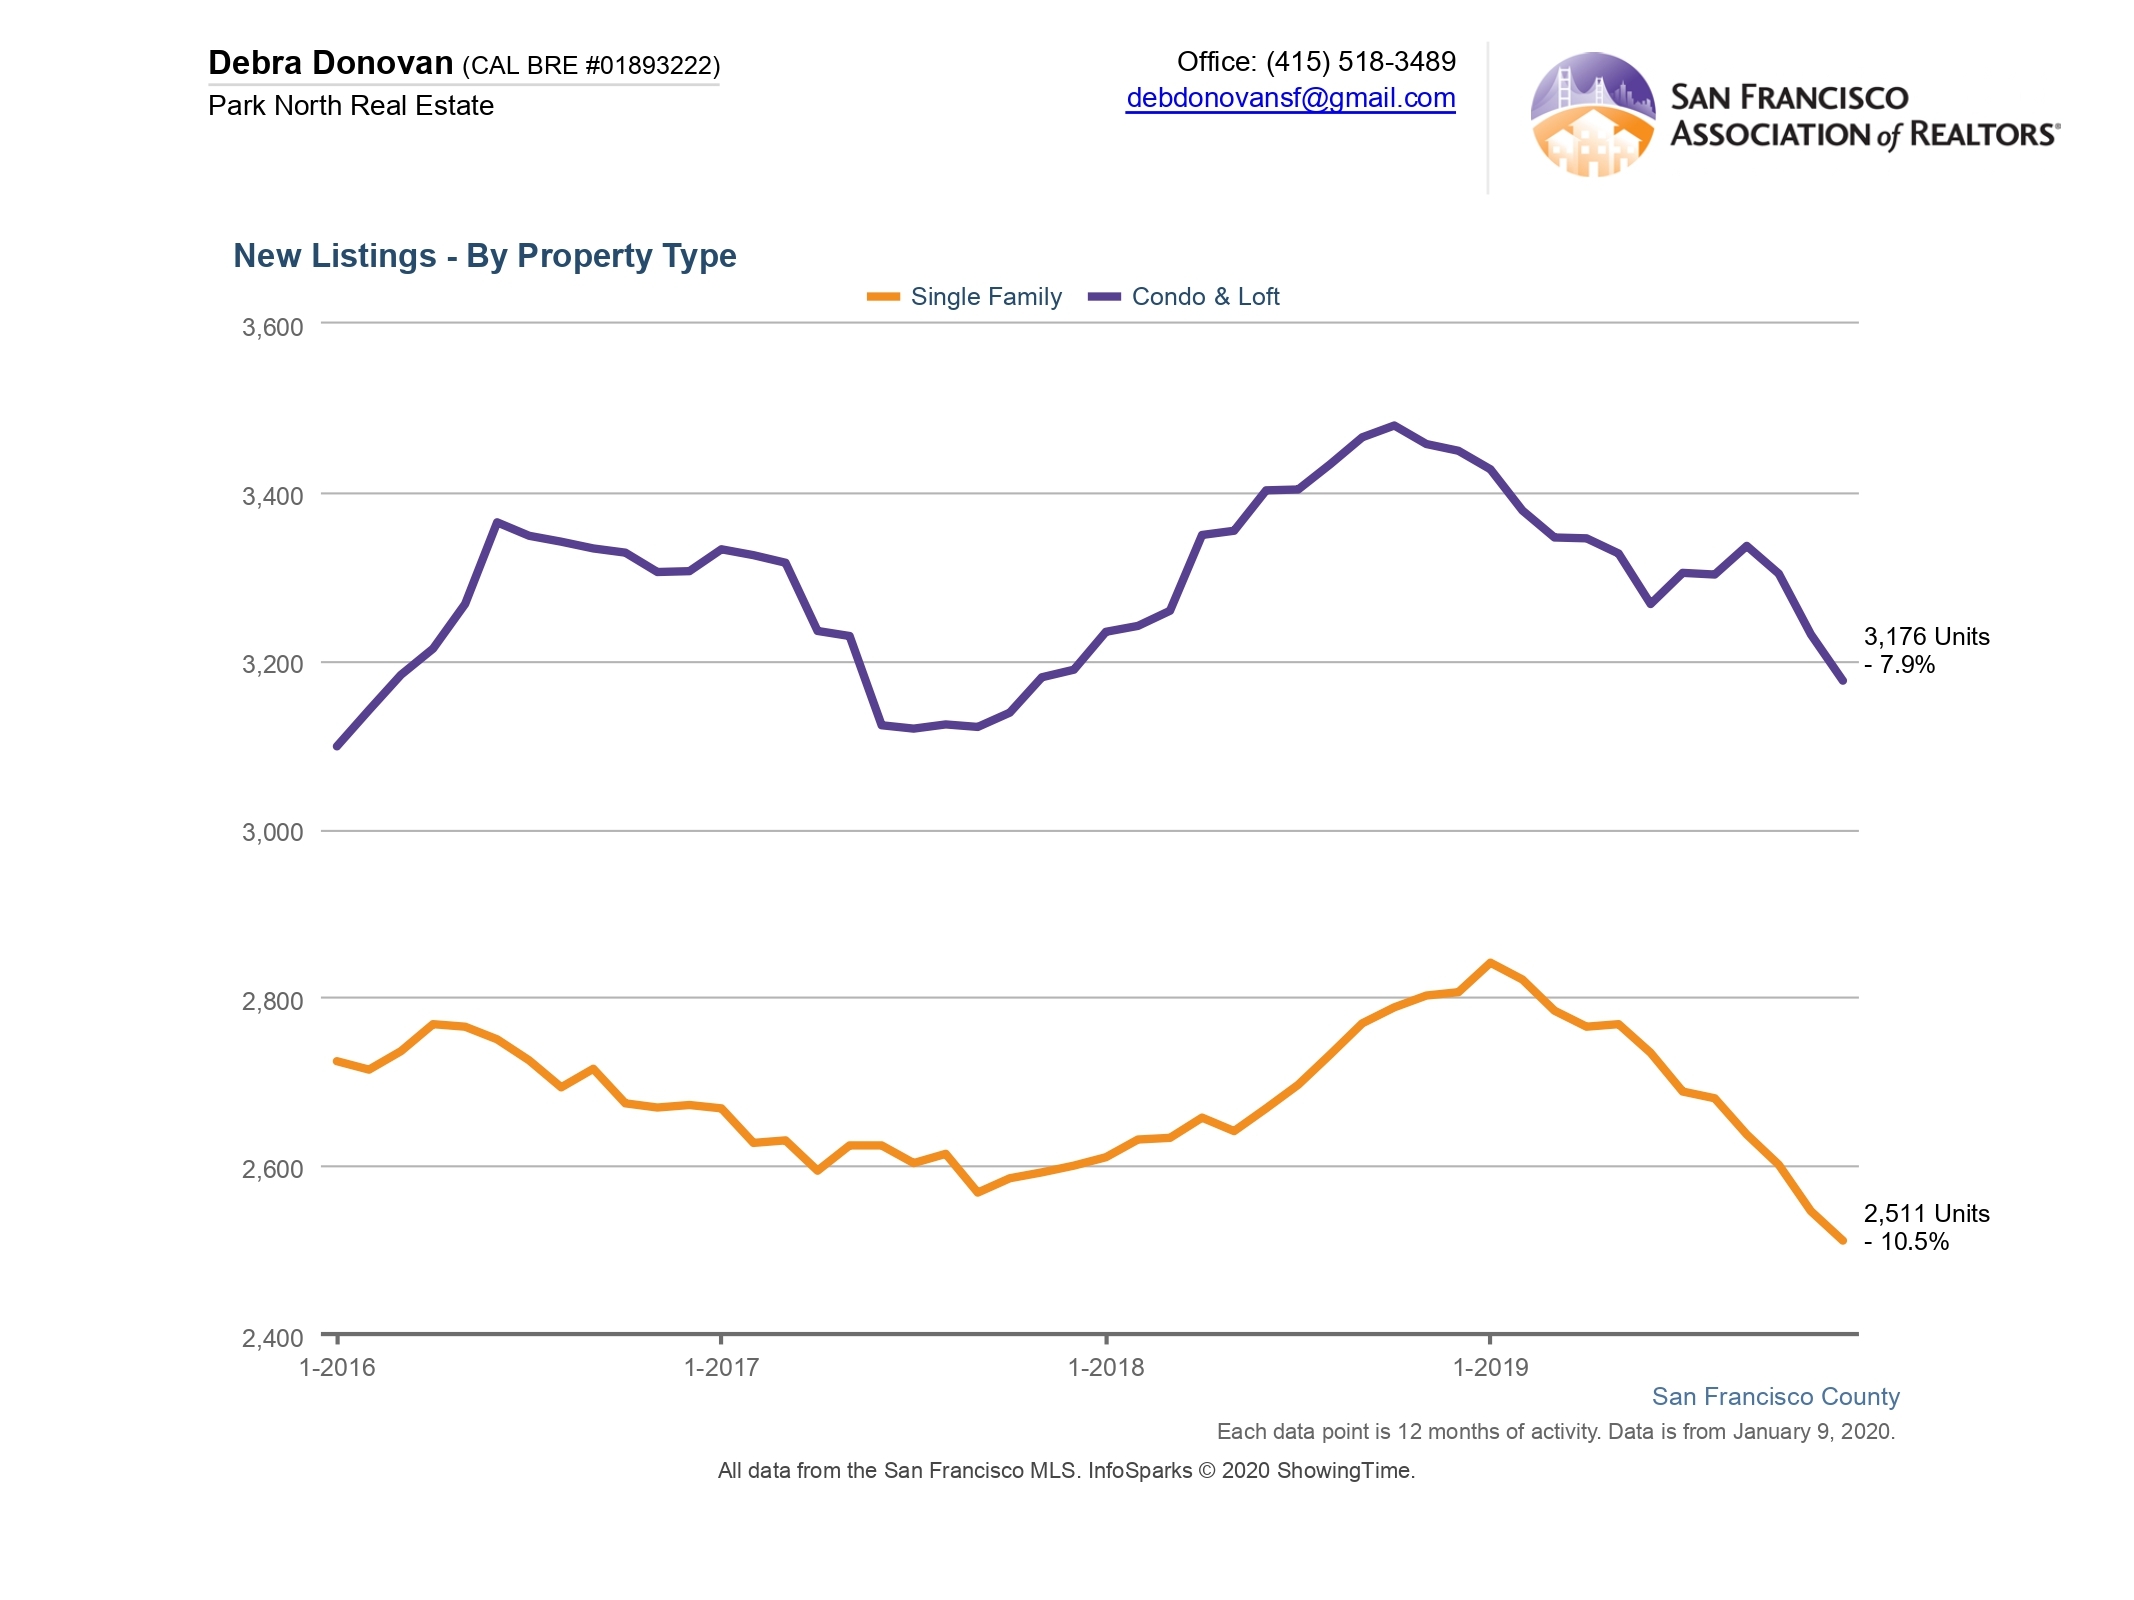
The number of new listings across the spectrum increased compared to previous years. New listings for single family homes increased 30% year-over-year. New condo and loft listings rose over 57%. This might seem like an inventory bonanza, but keep in mind that we’ve had several years of inventory anemia and July is typically one of the slowest months of the year. When the SIP hit in March many sellers chose to pull their home off the market or just wait. So we’re almost seeing a late Spring selling season now but the data is comparing this month to a relatively slow month the year before. Compared to last month, single family homes had almost the exact same number of new listings. Condos and lofts saw a slight lift in new inventory compared to June.
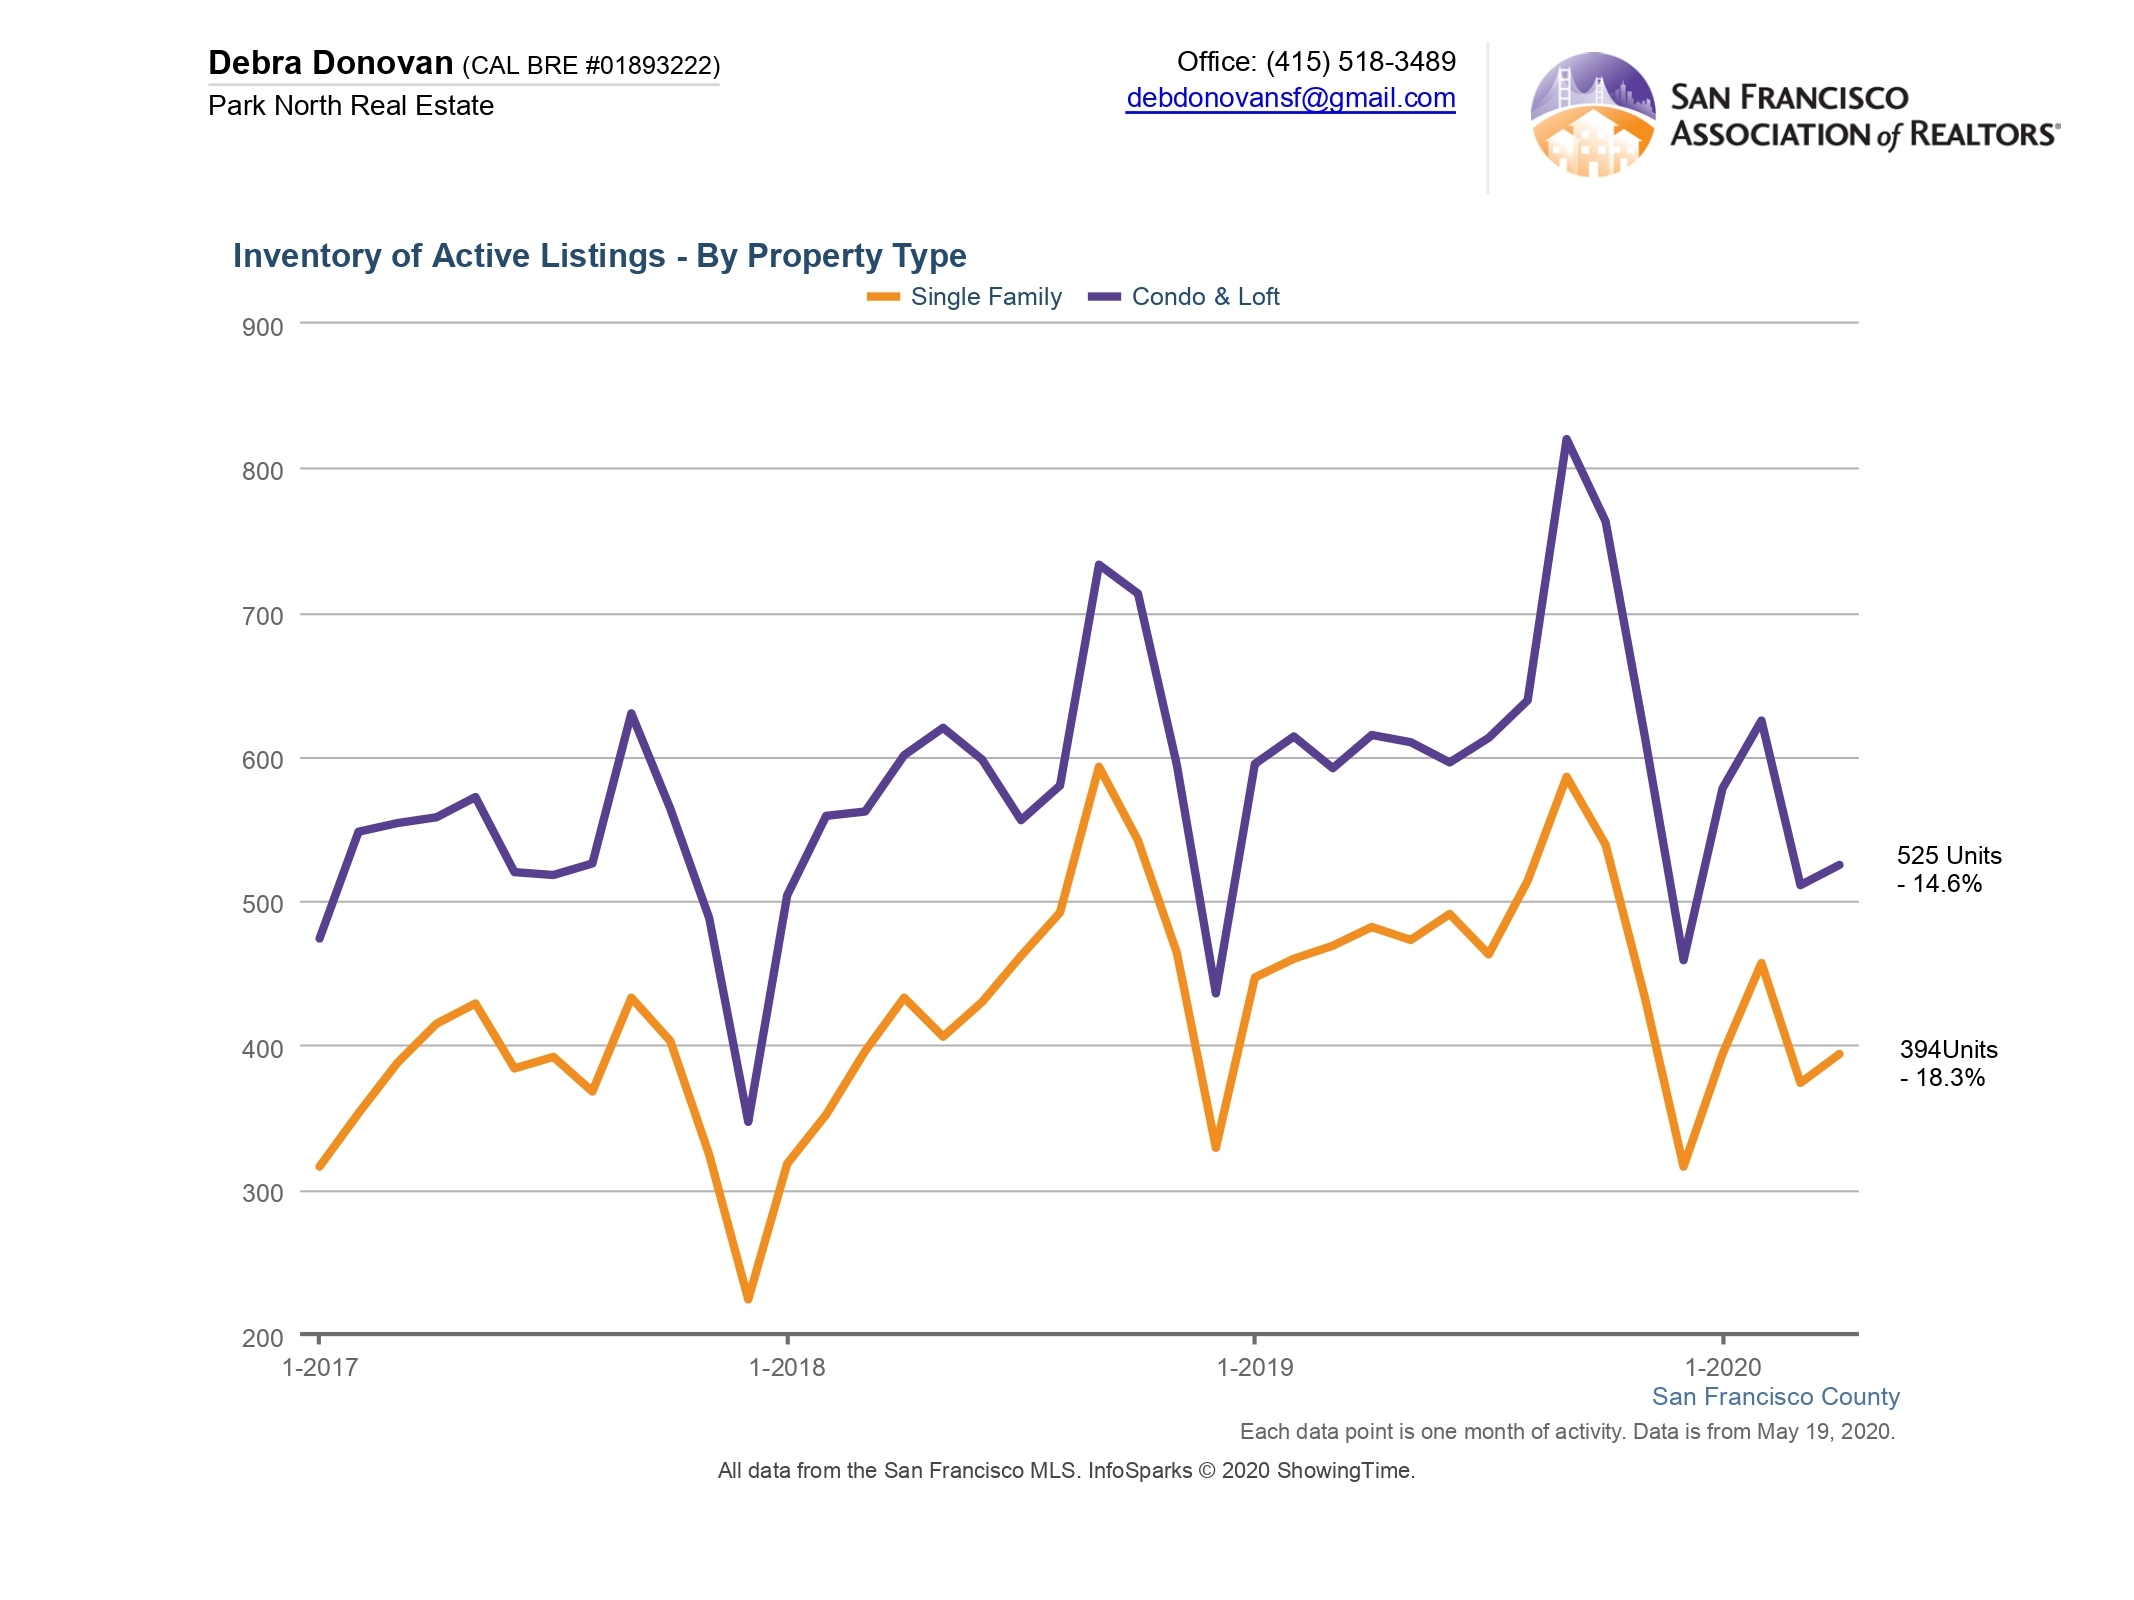
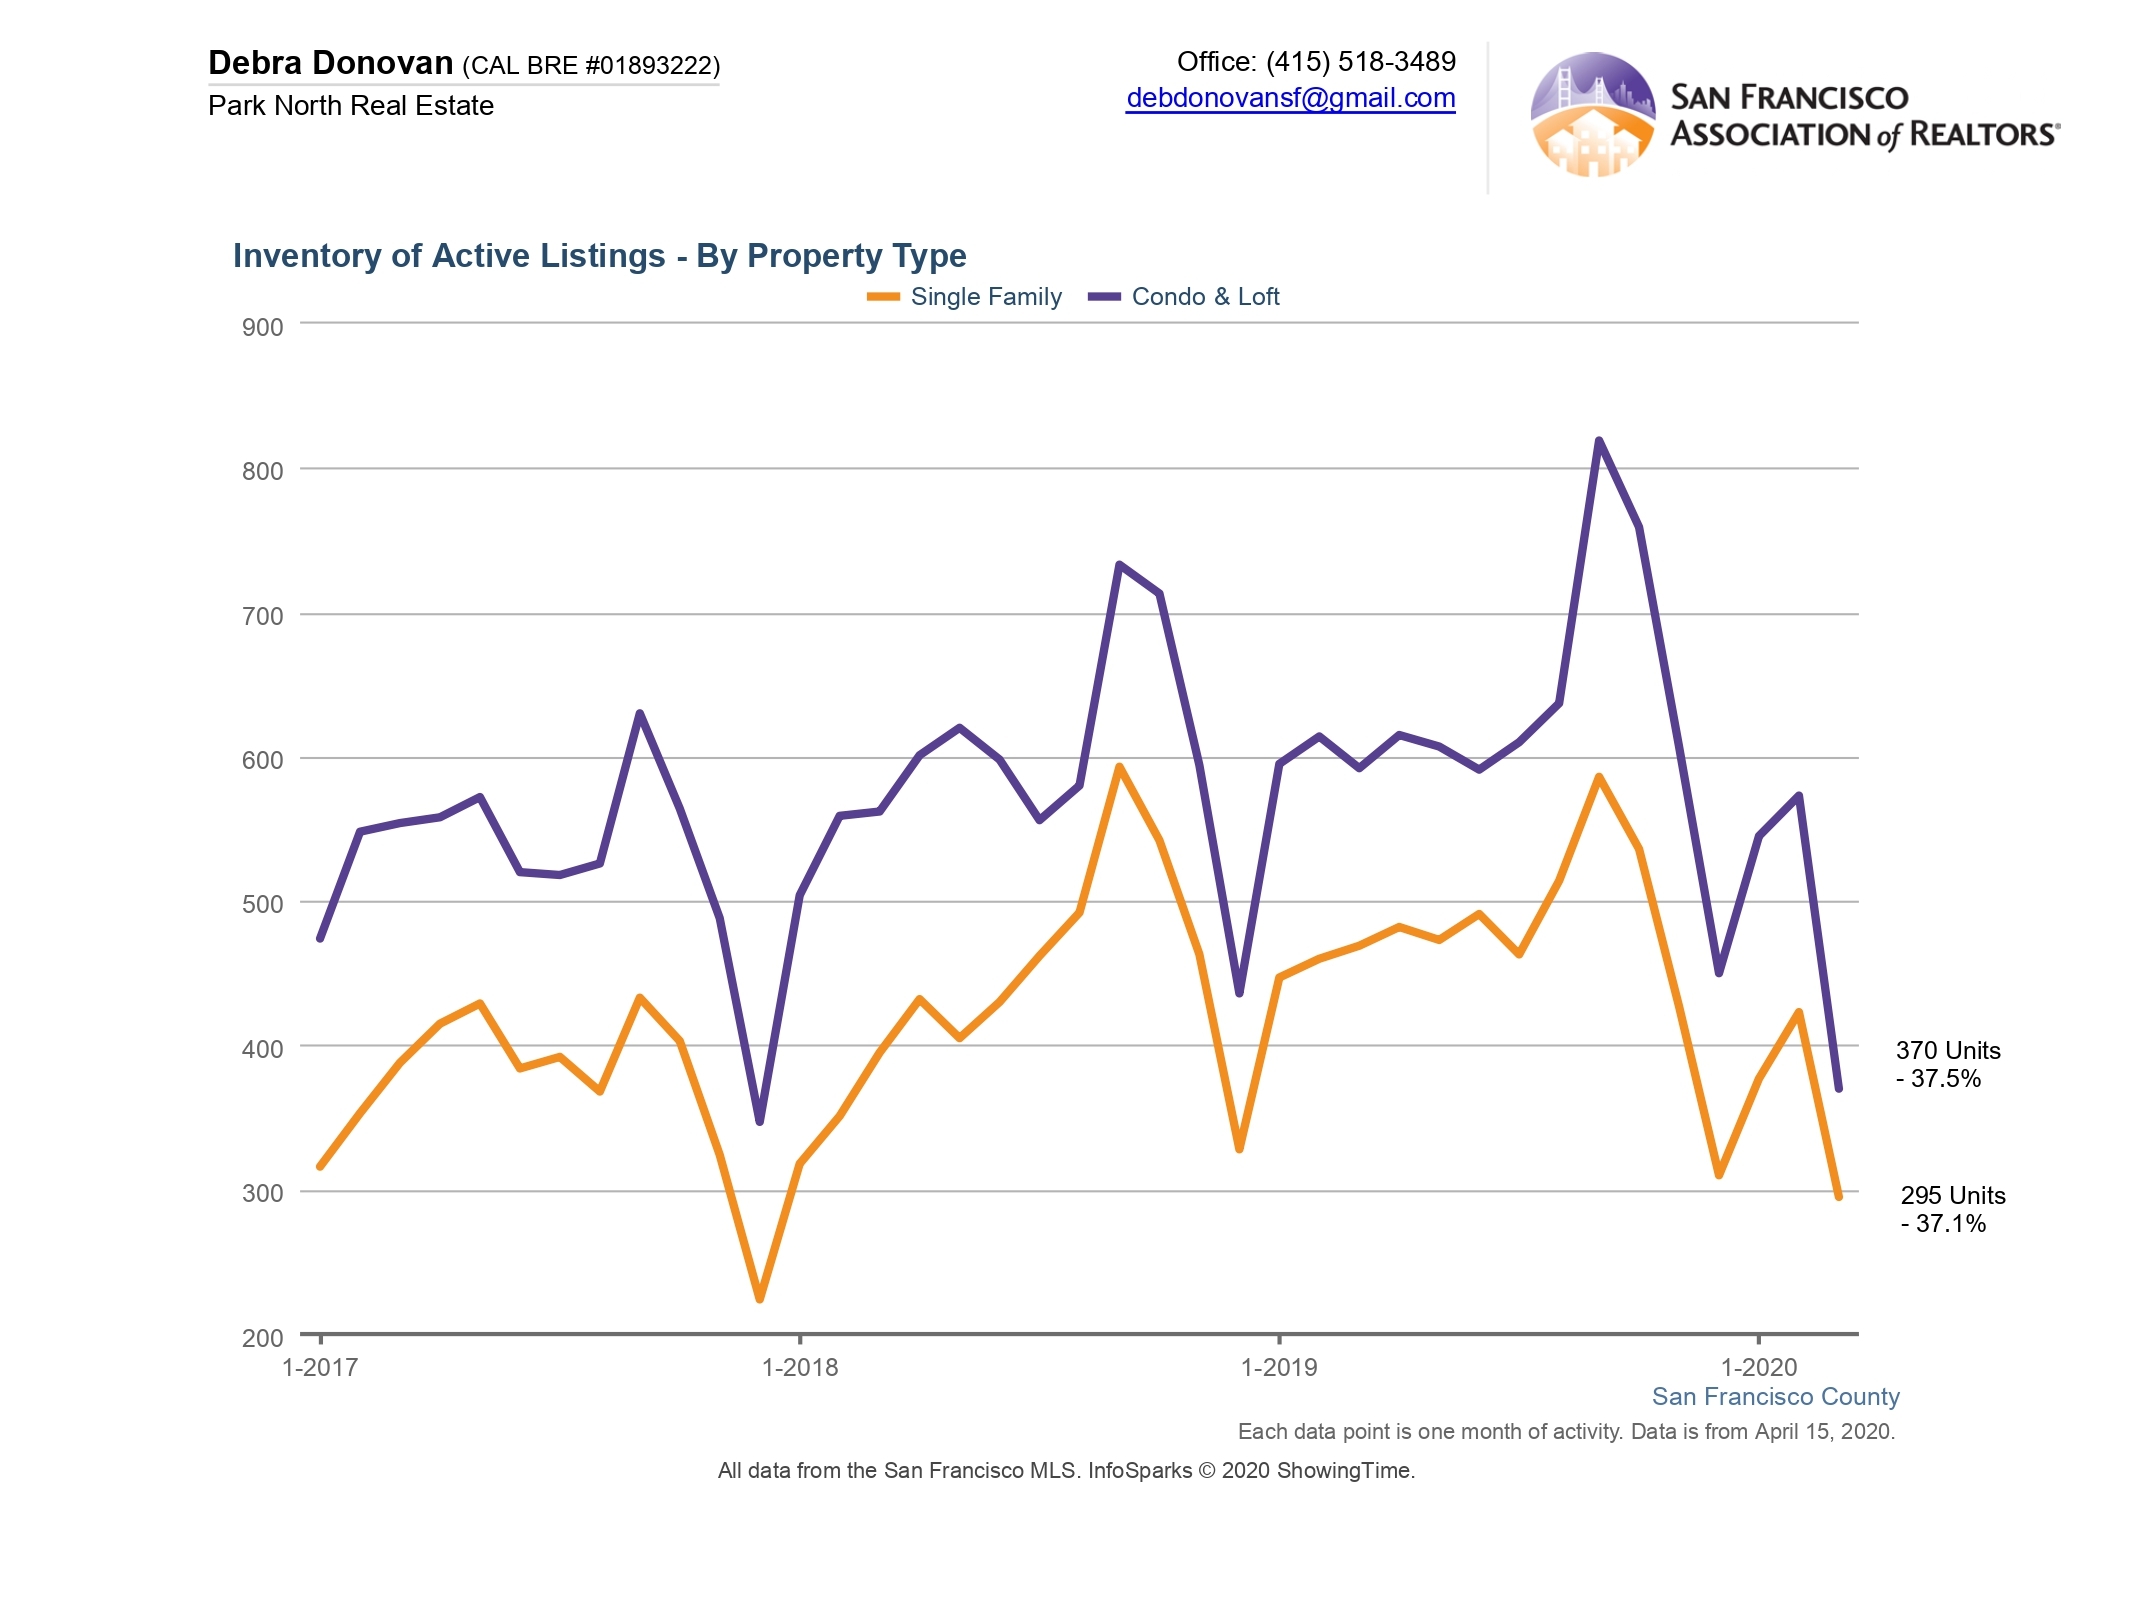
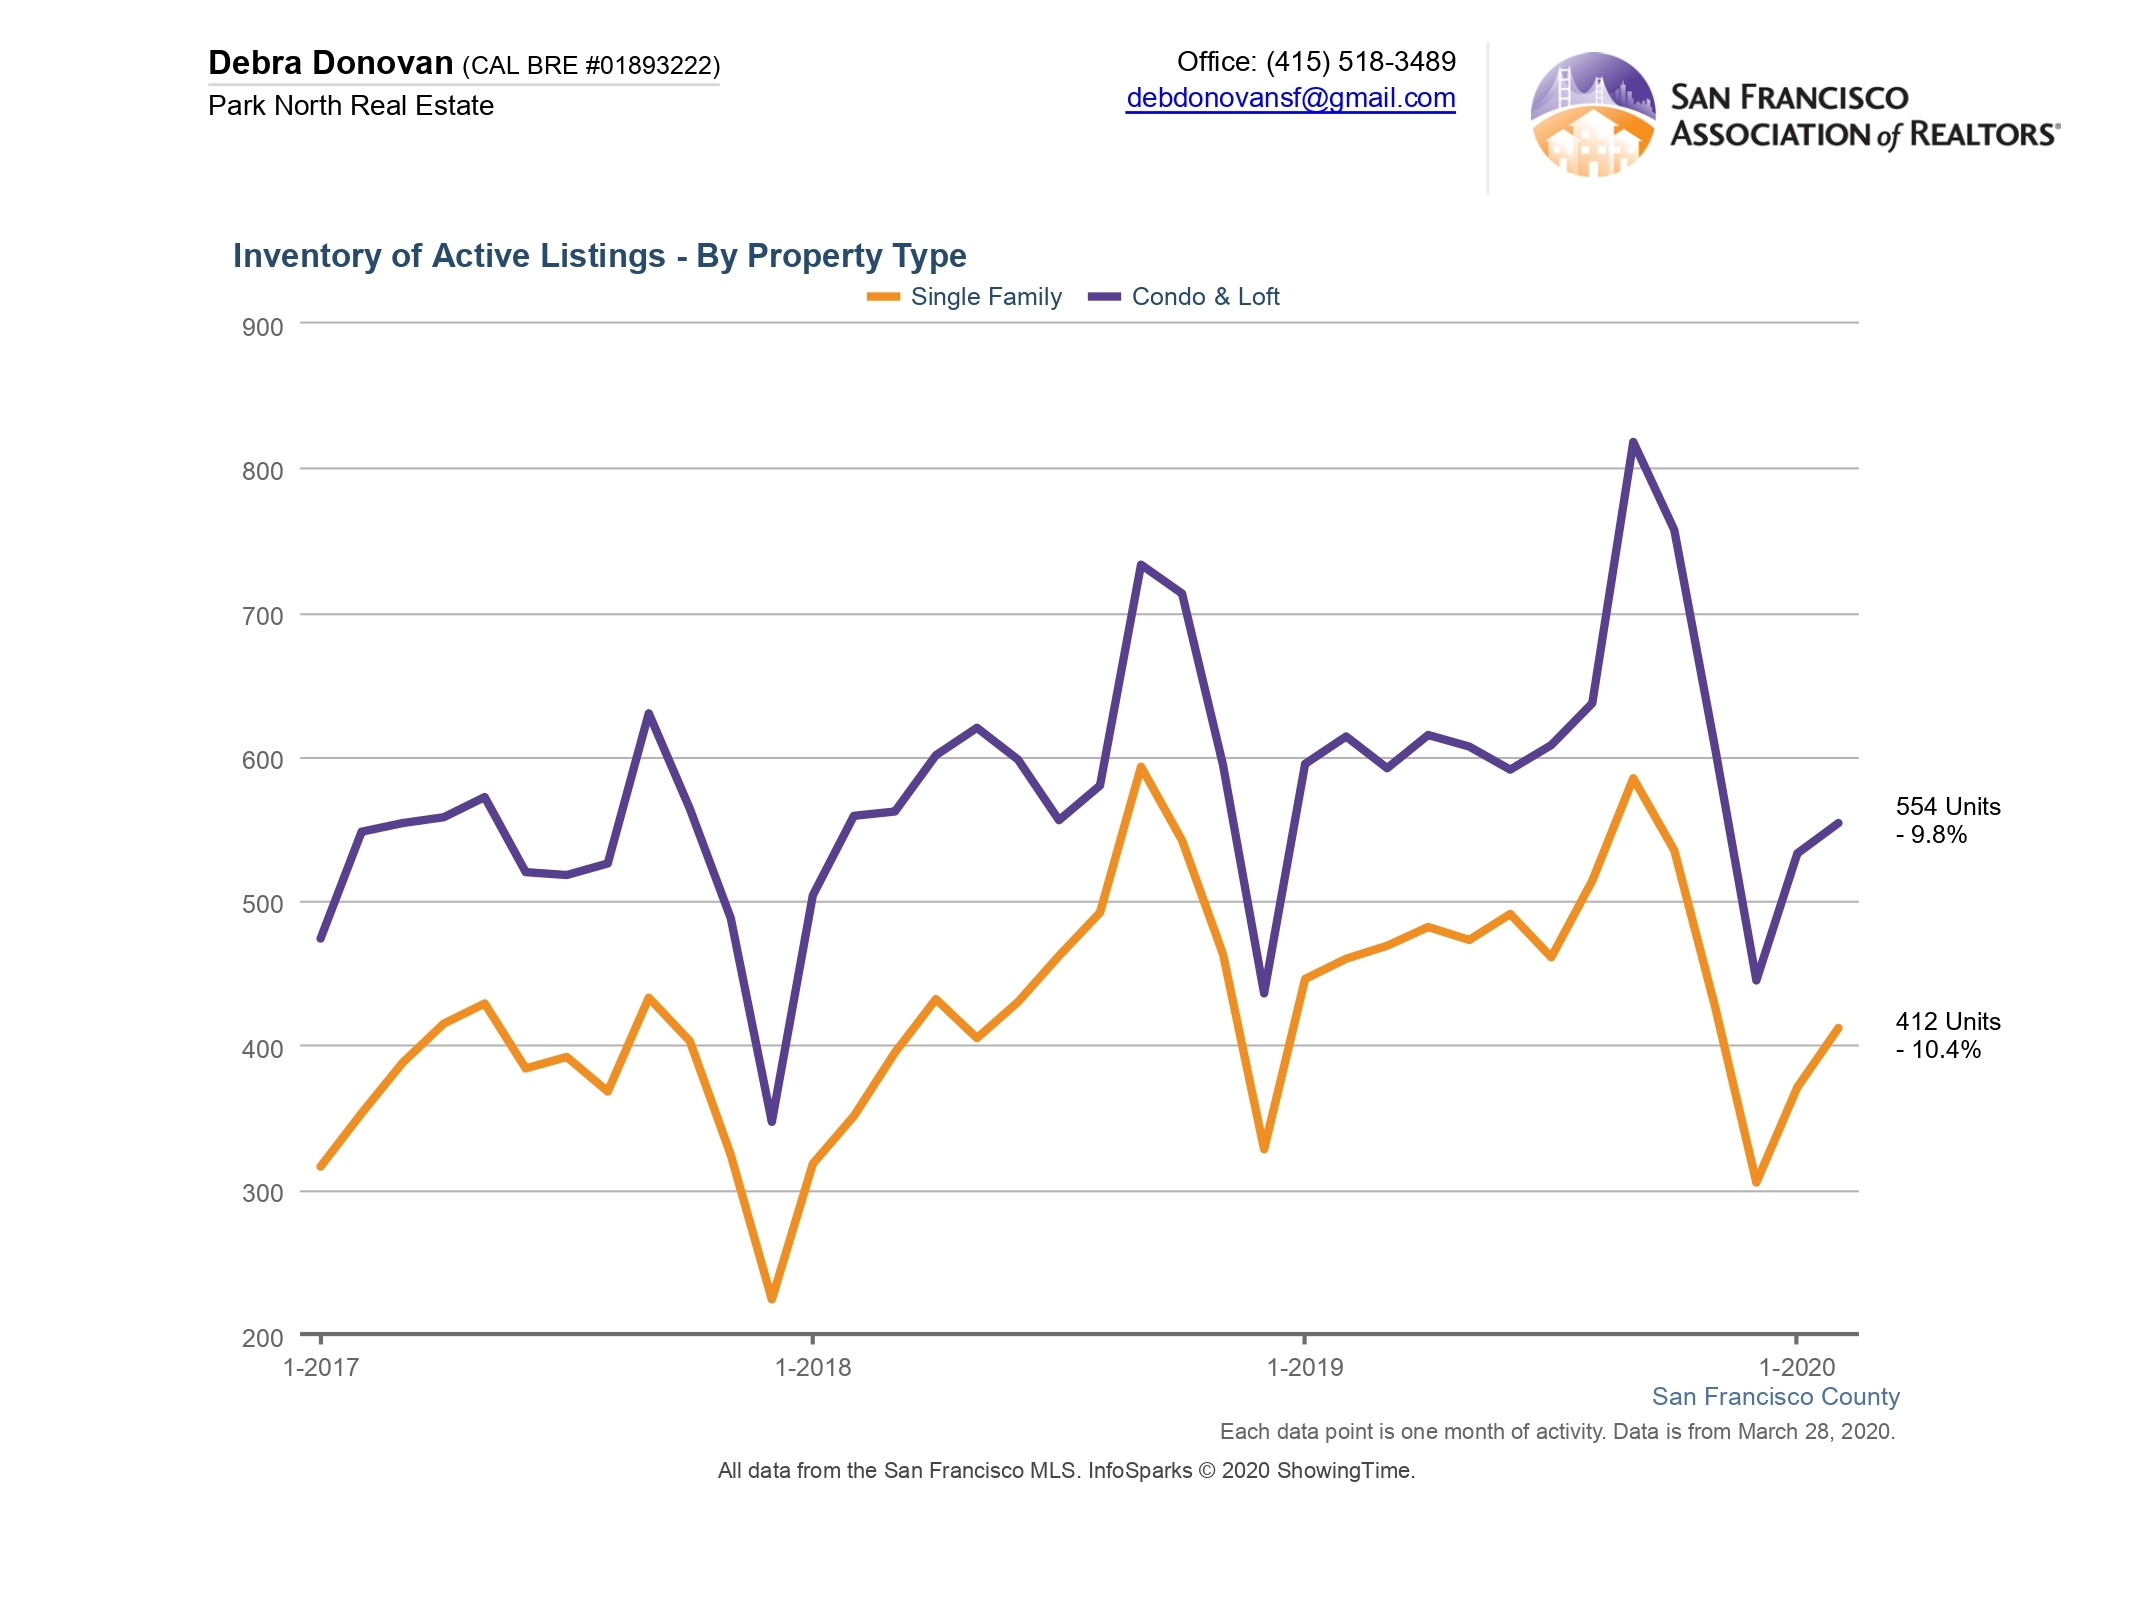
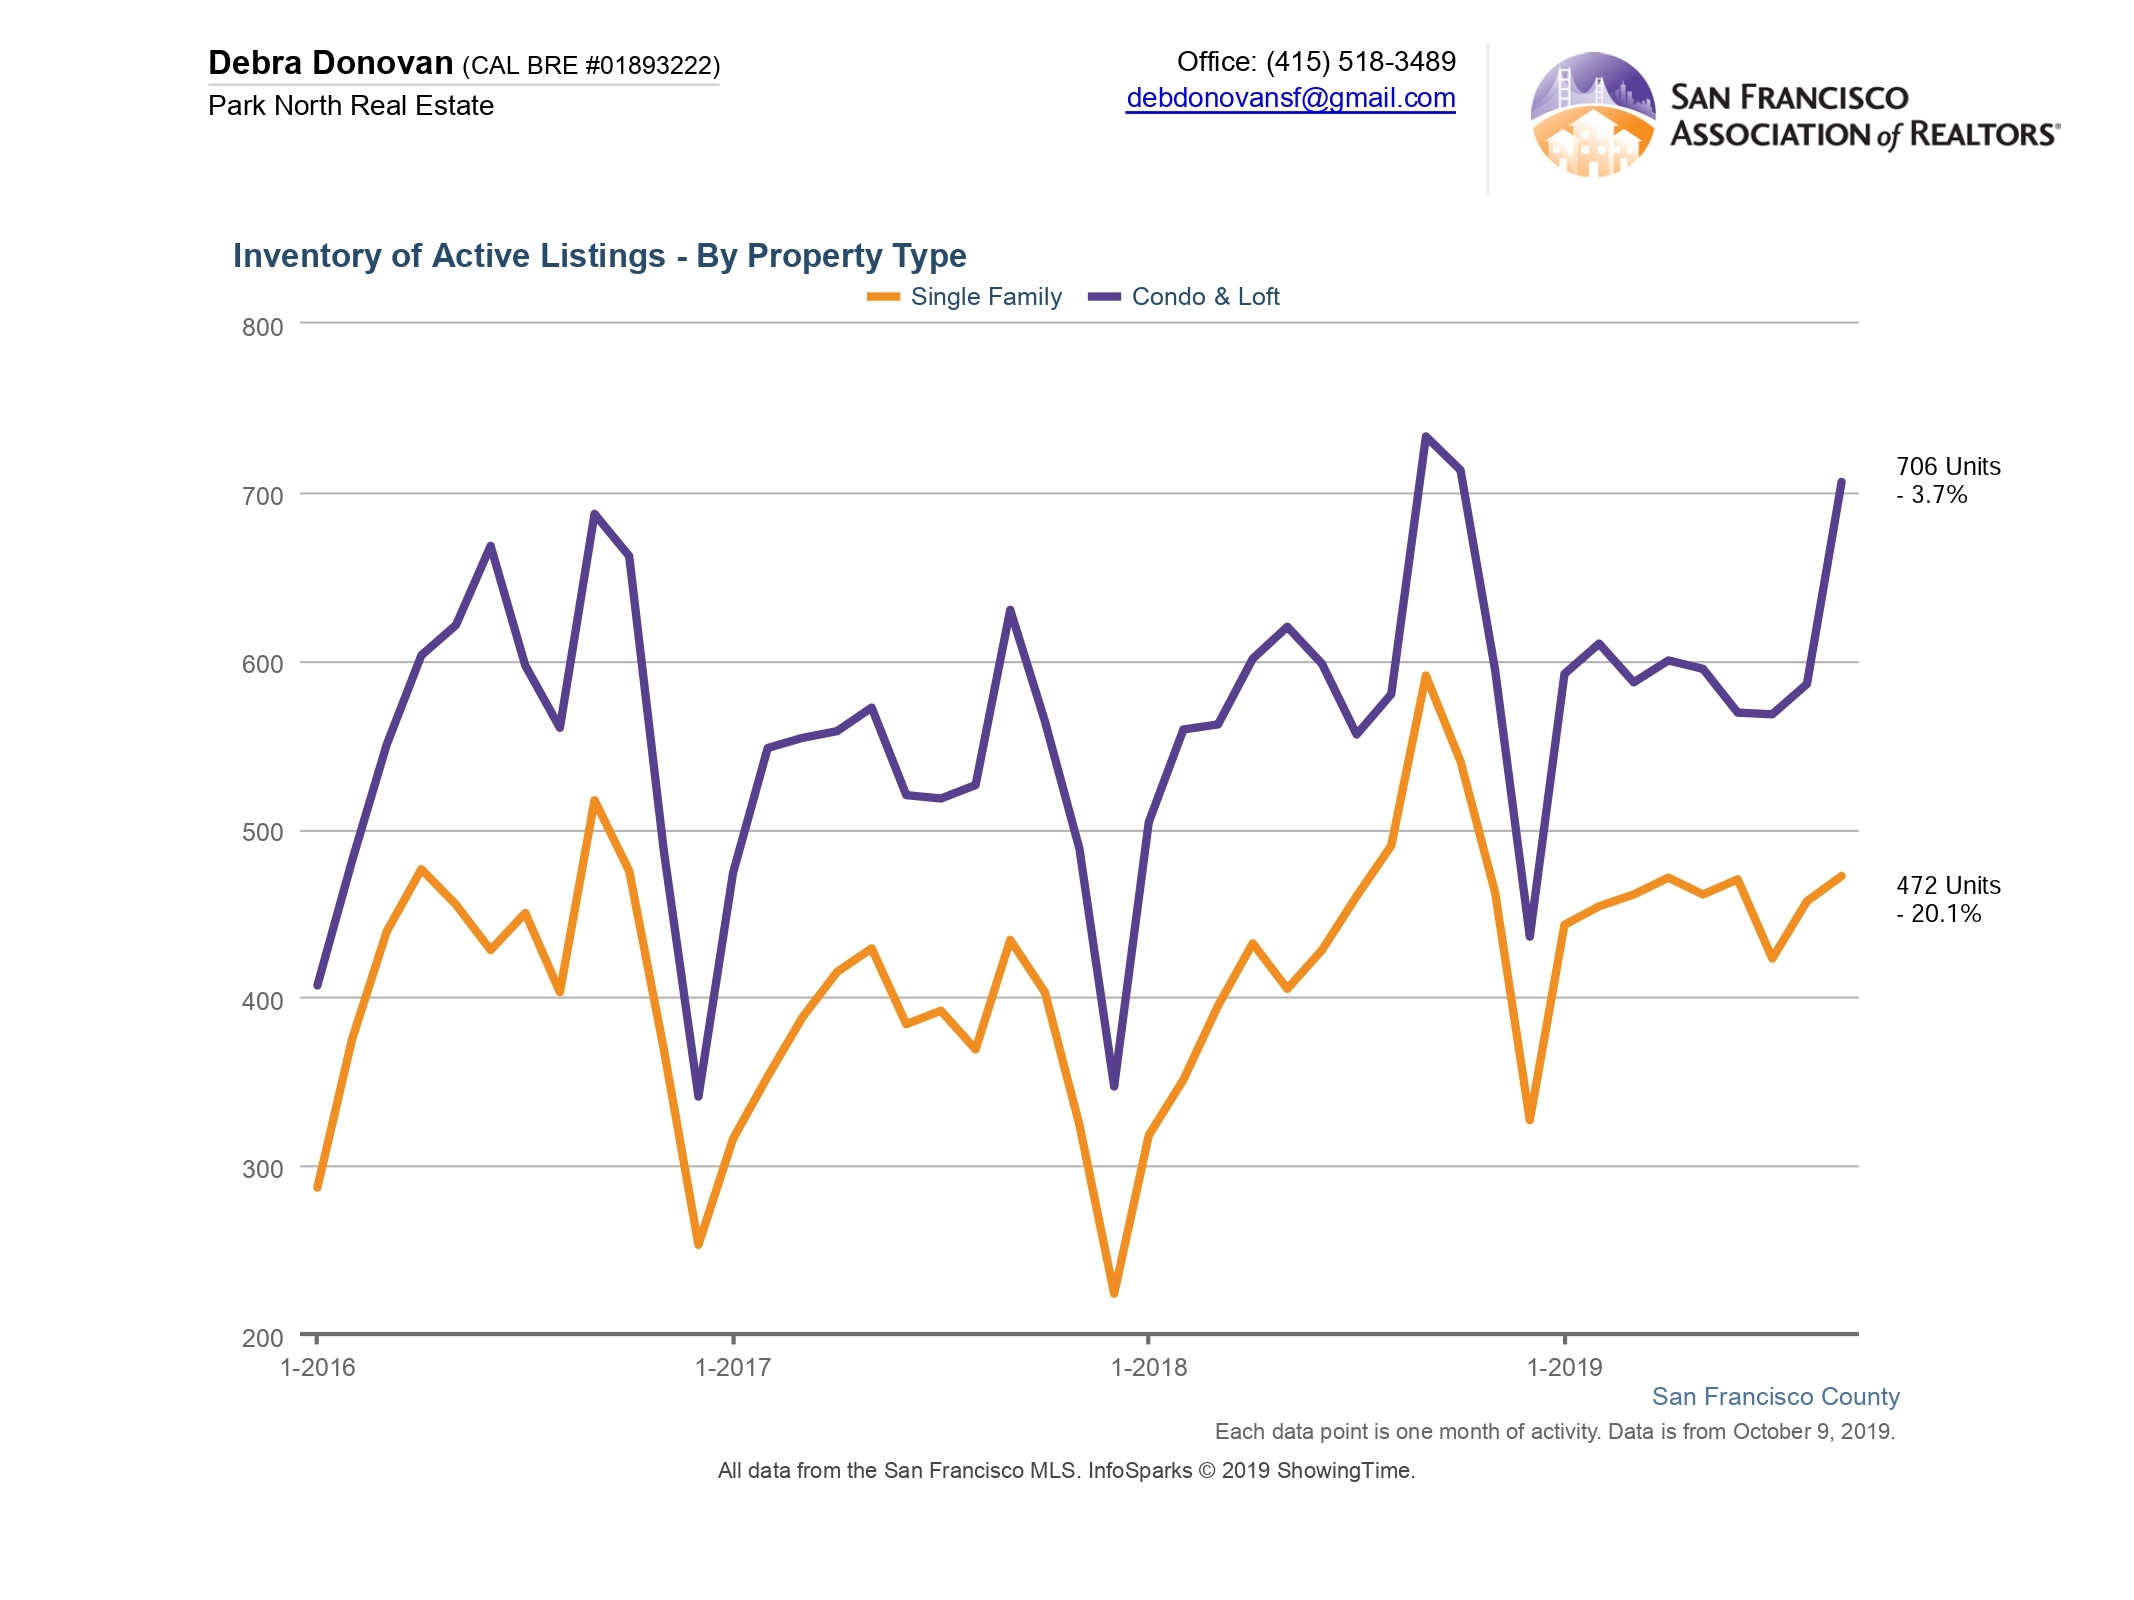
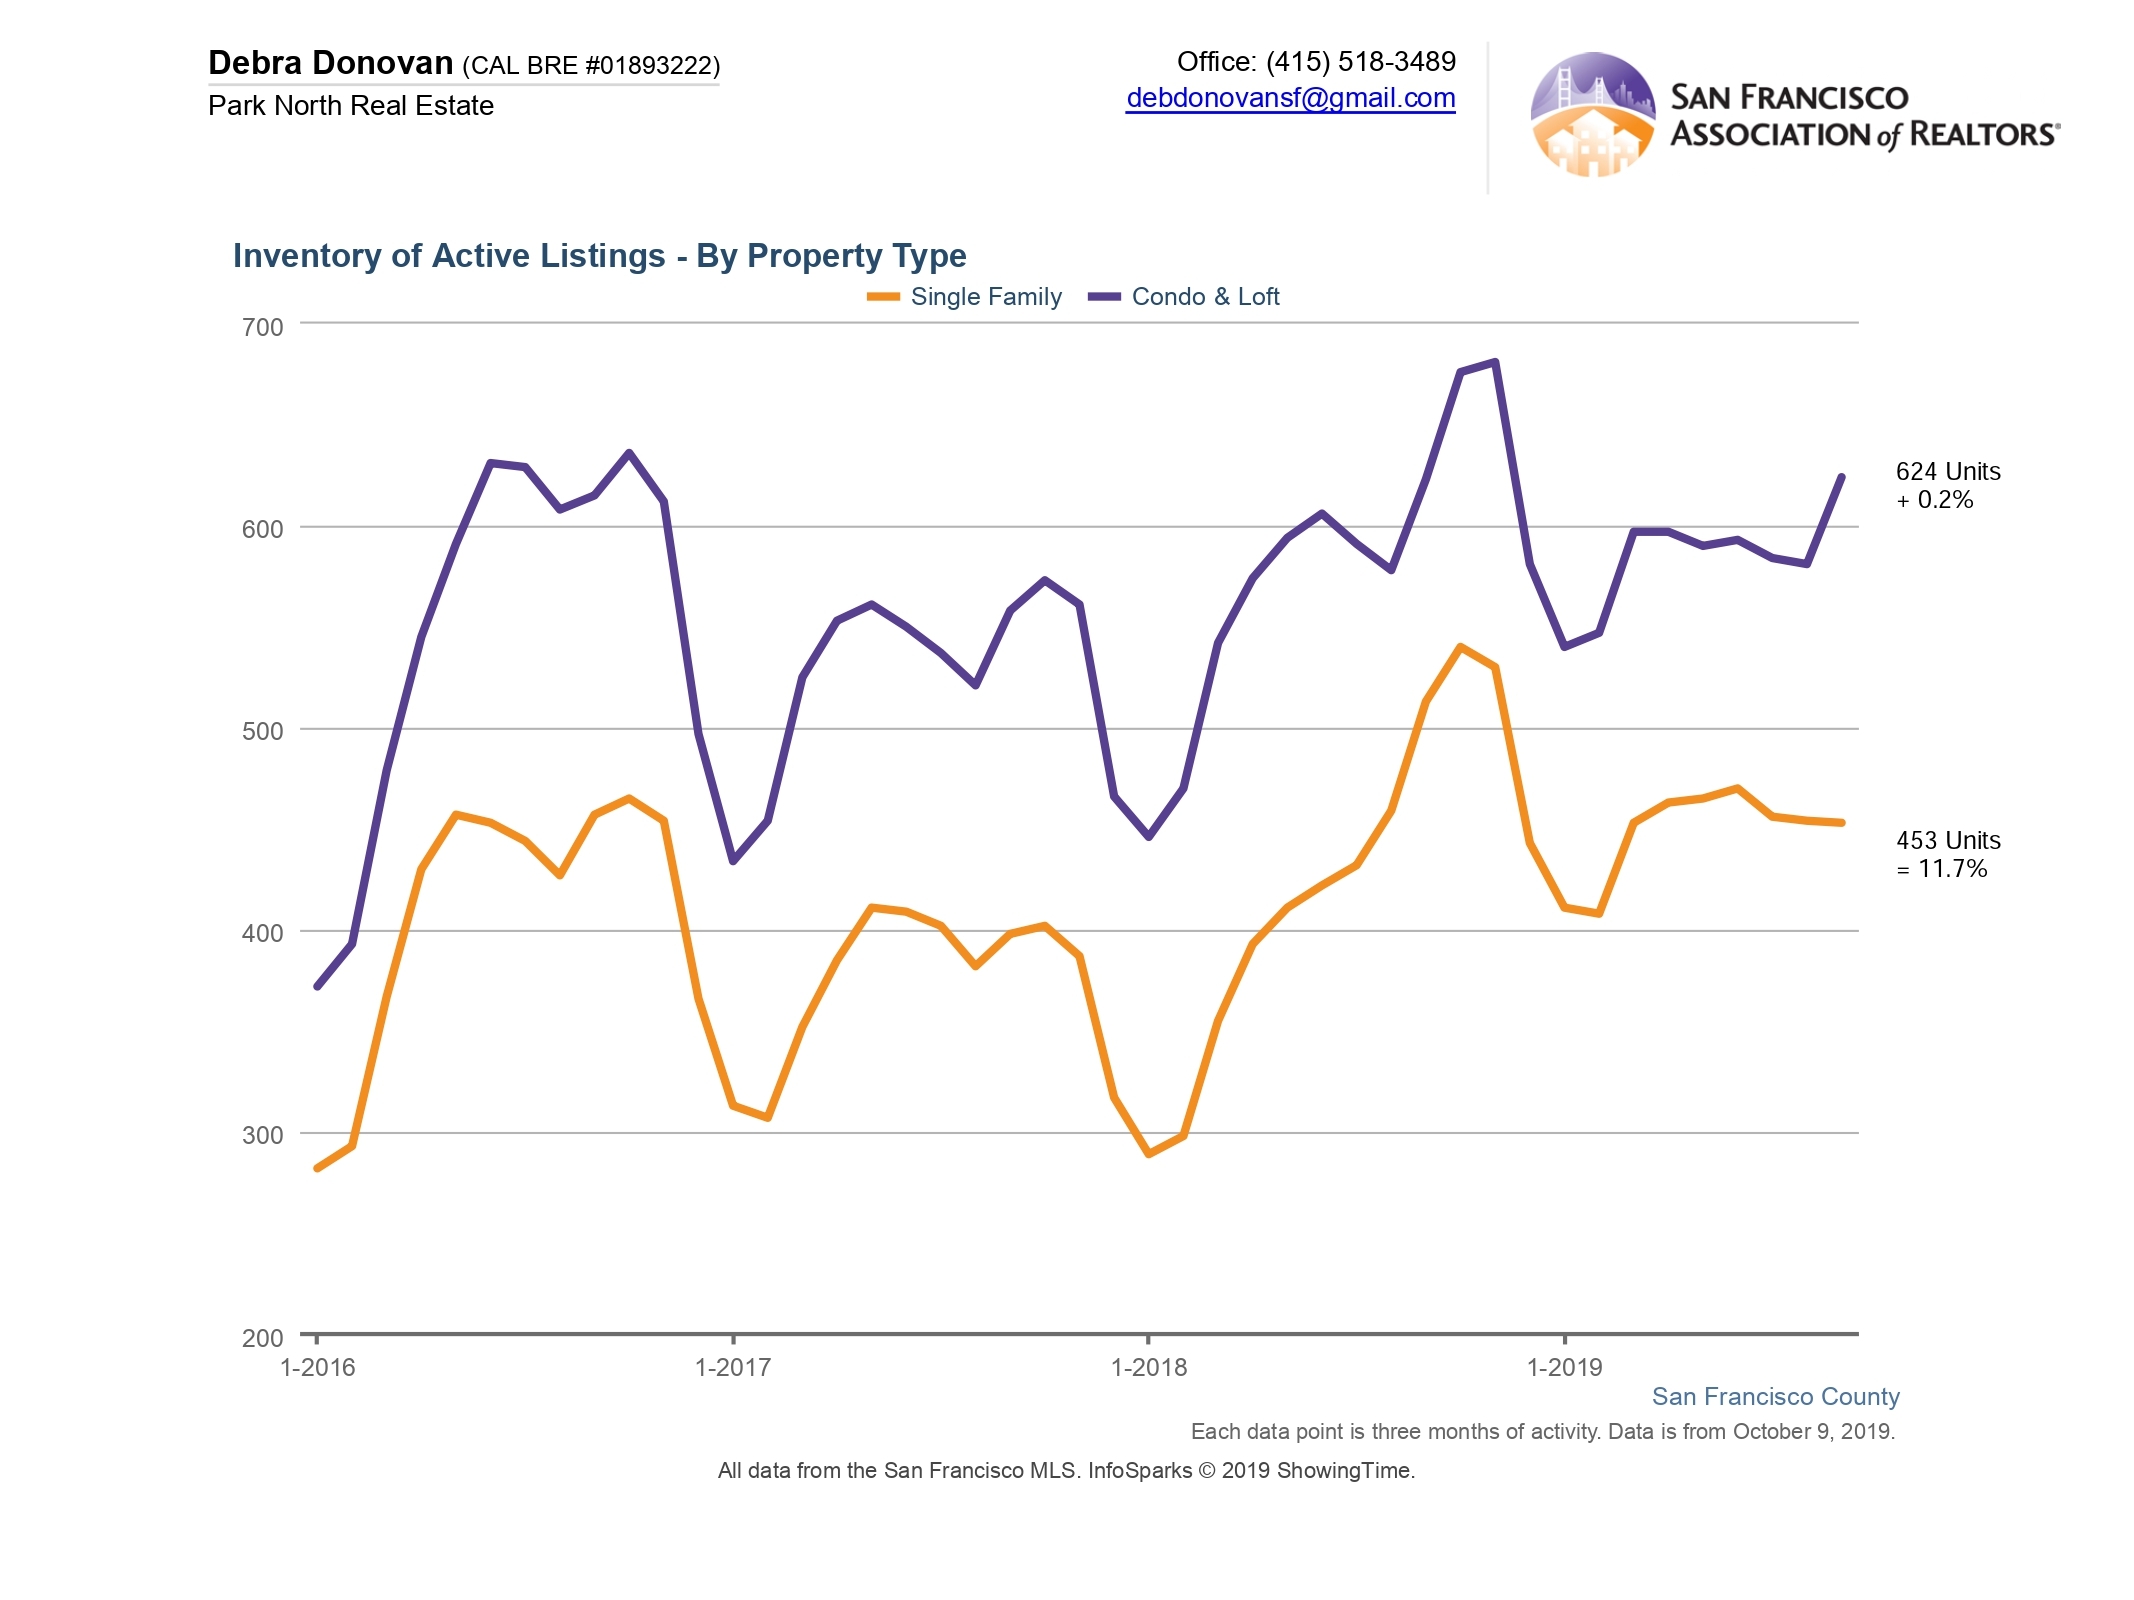
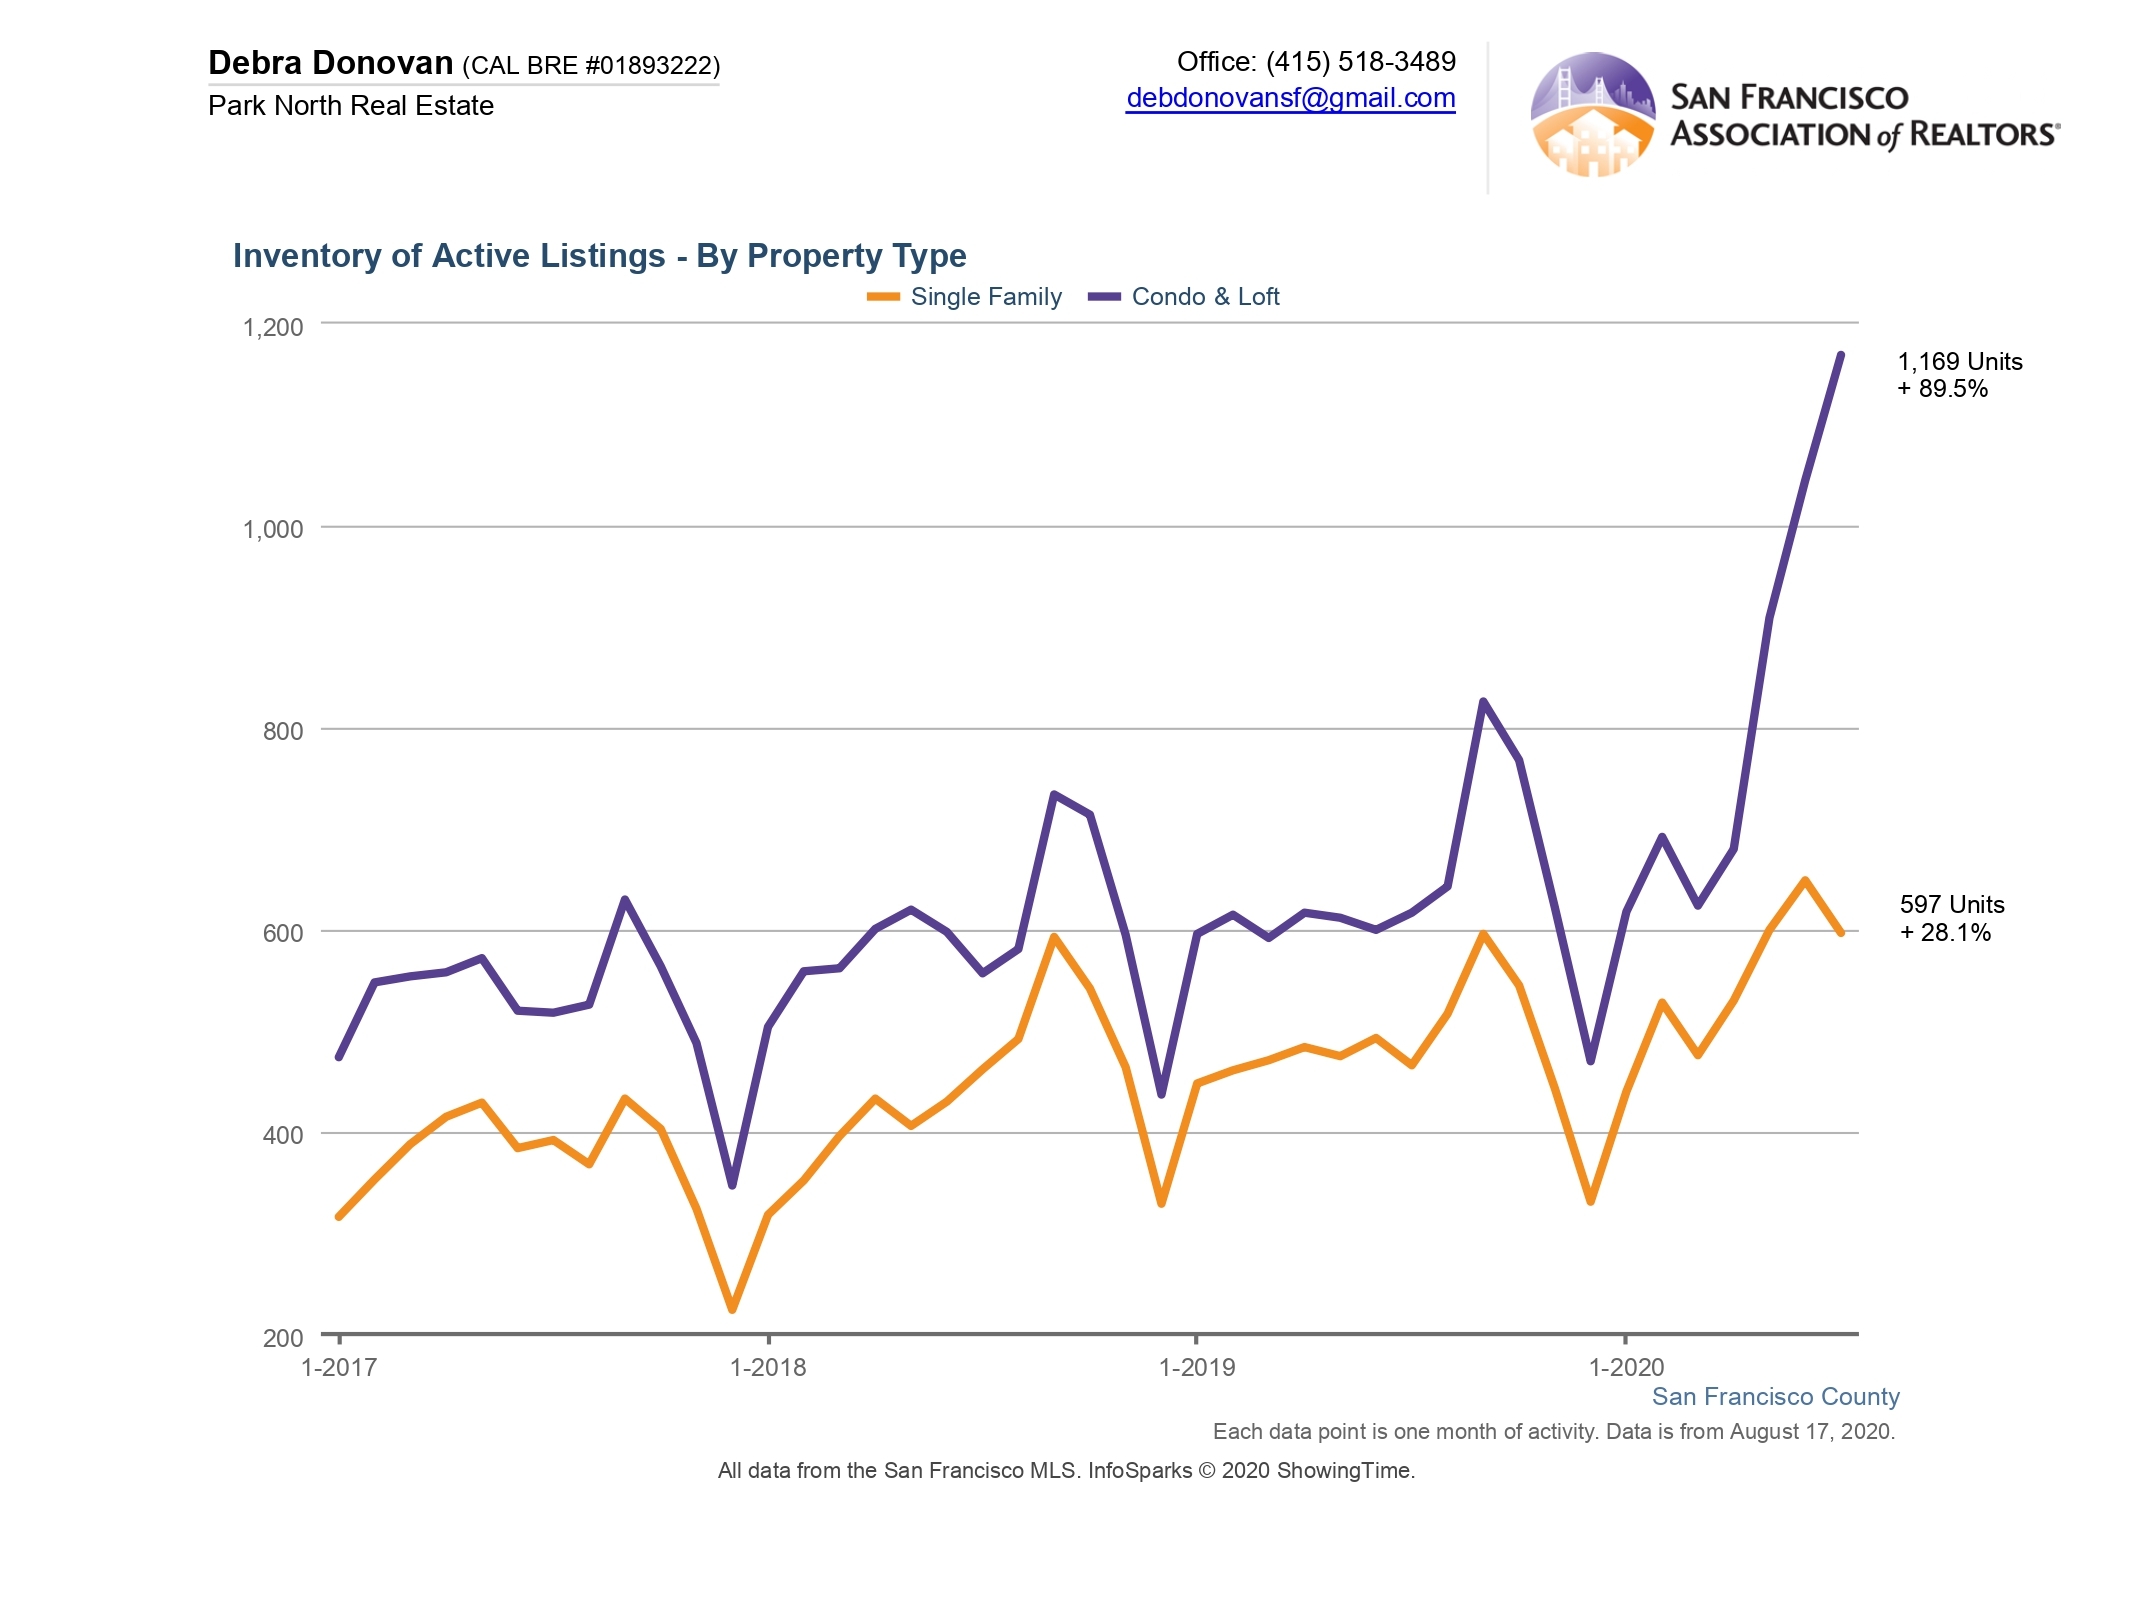
Active Listings:
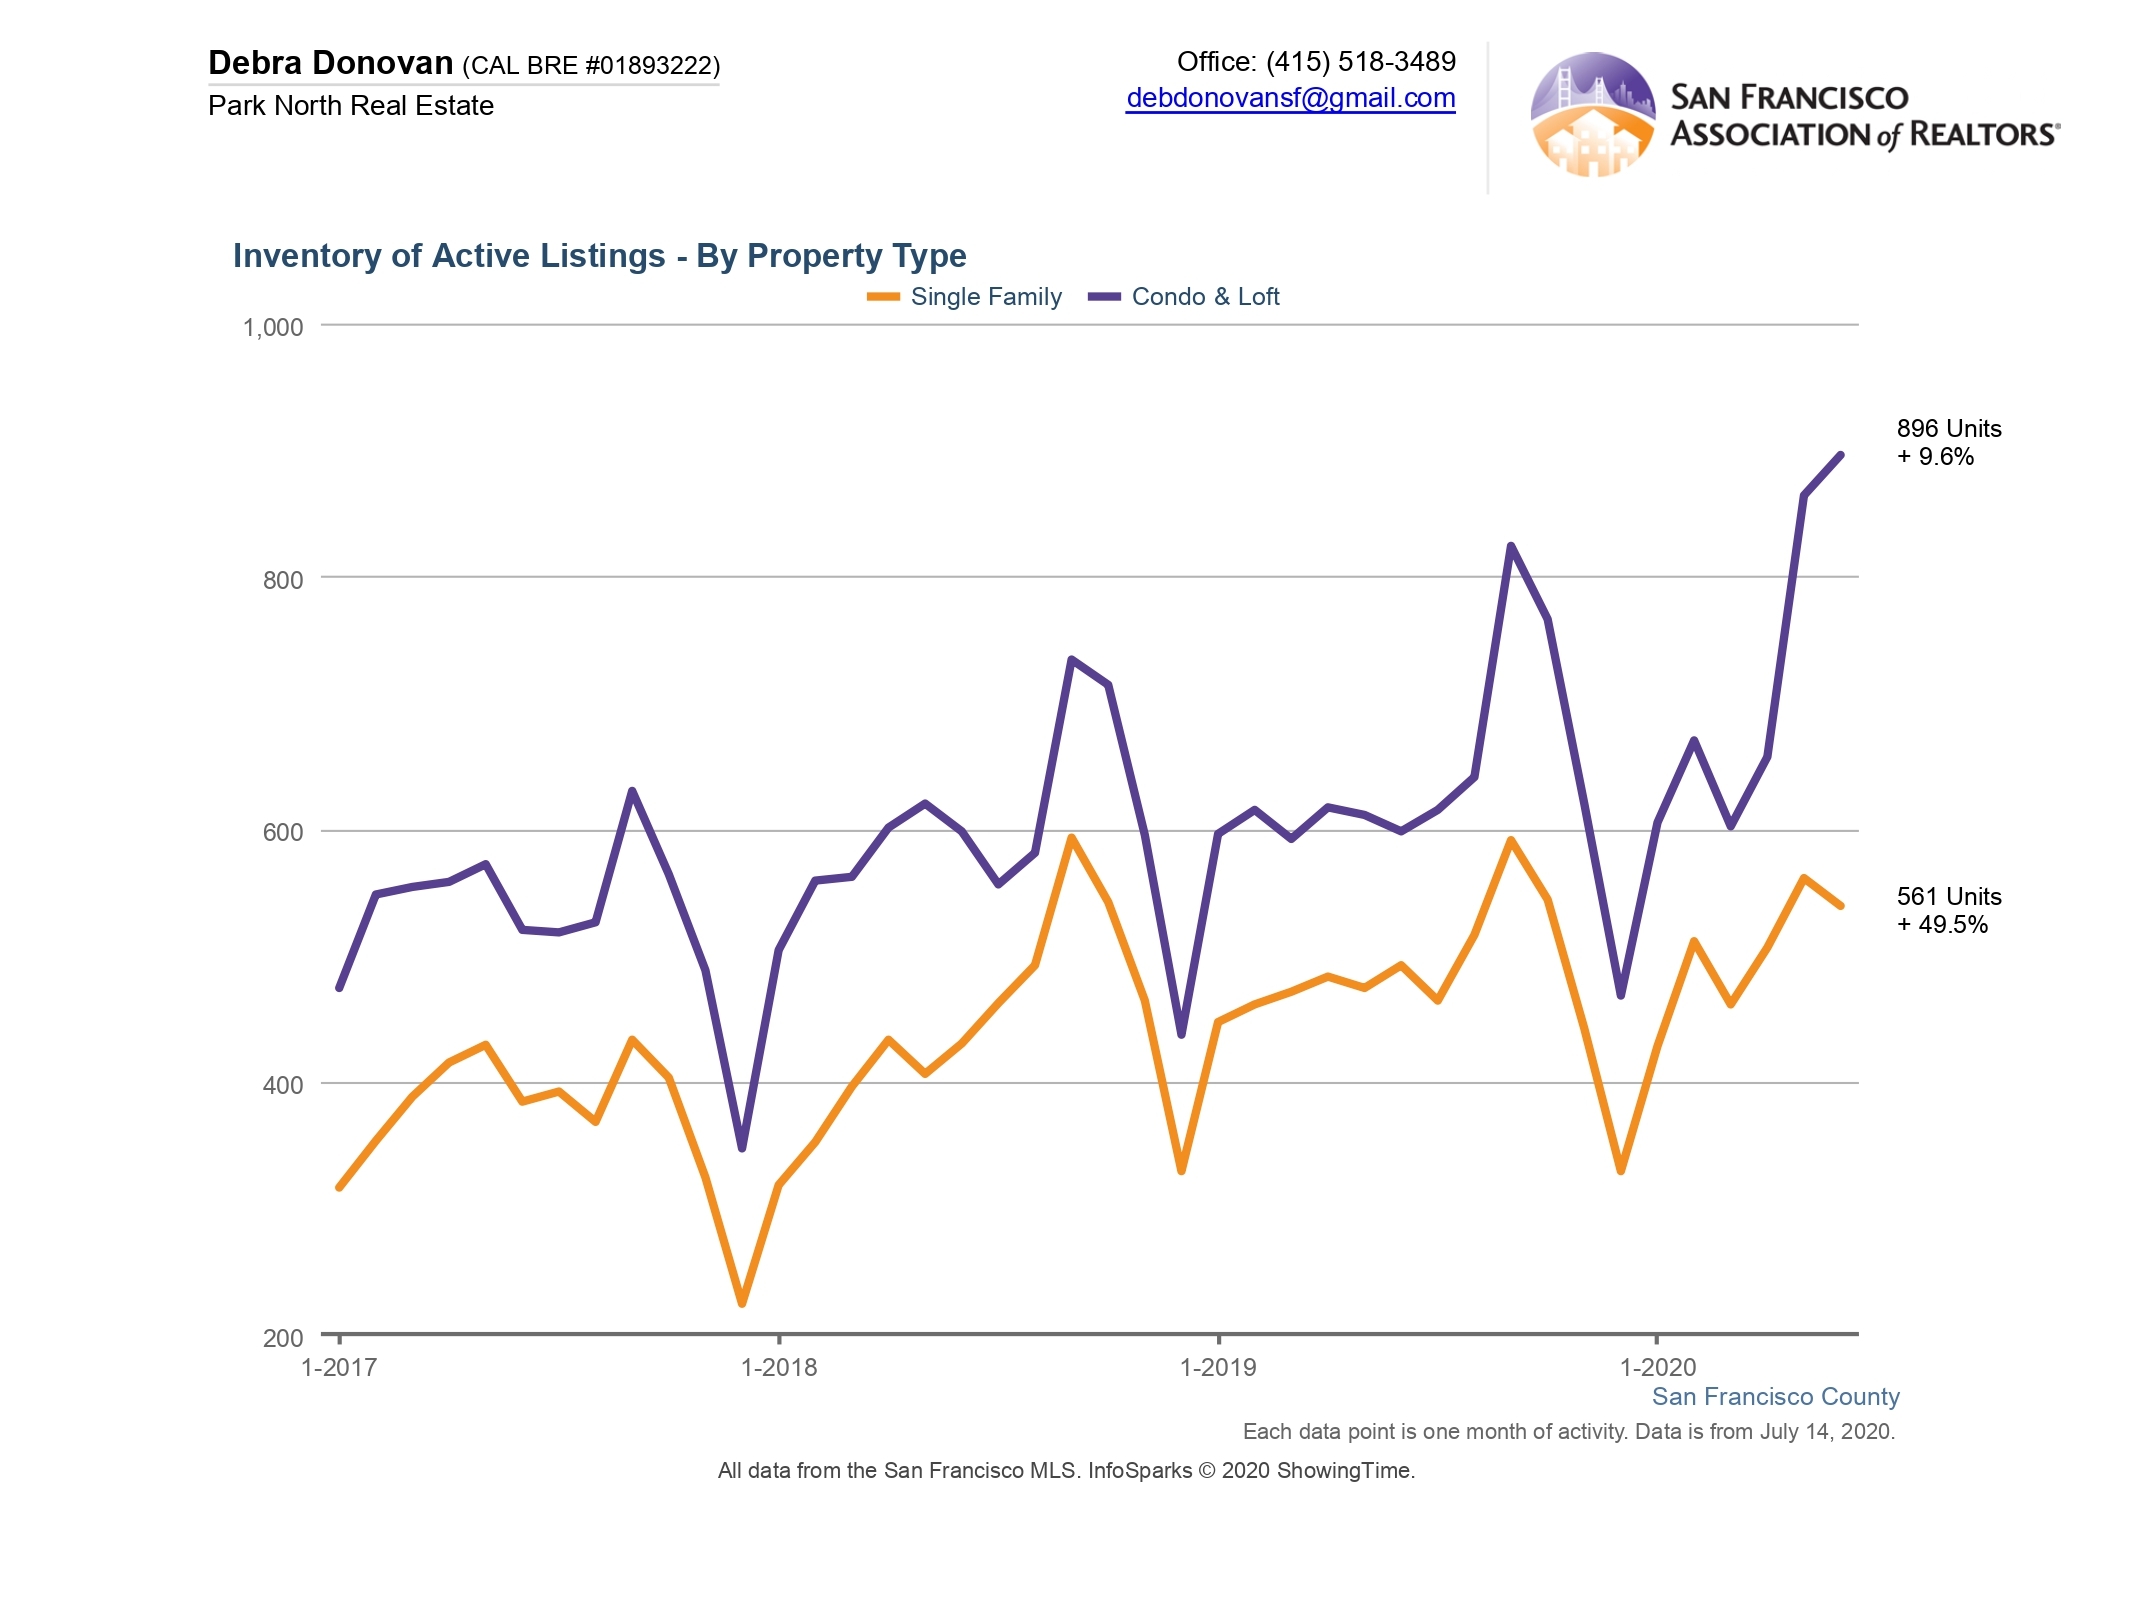
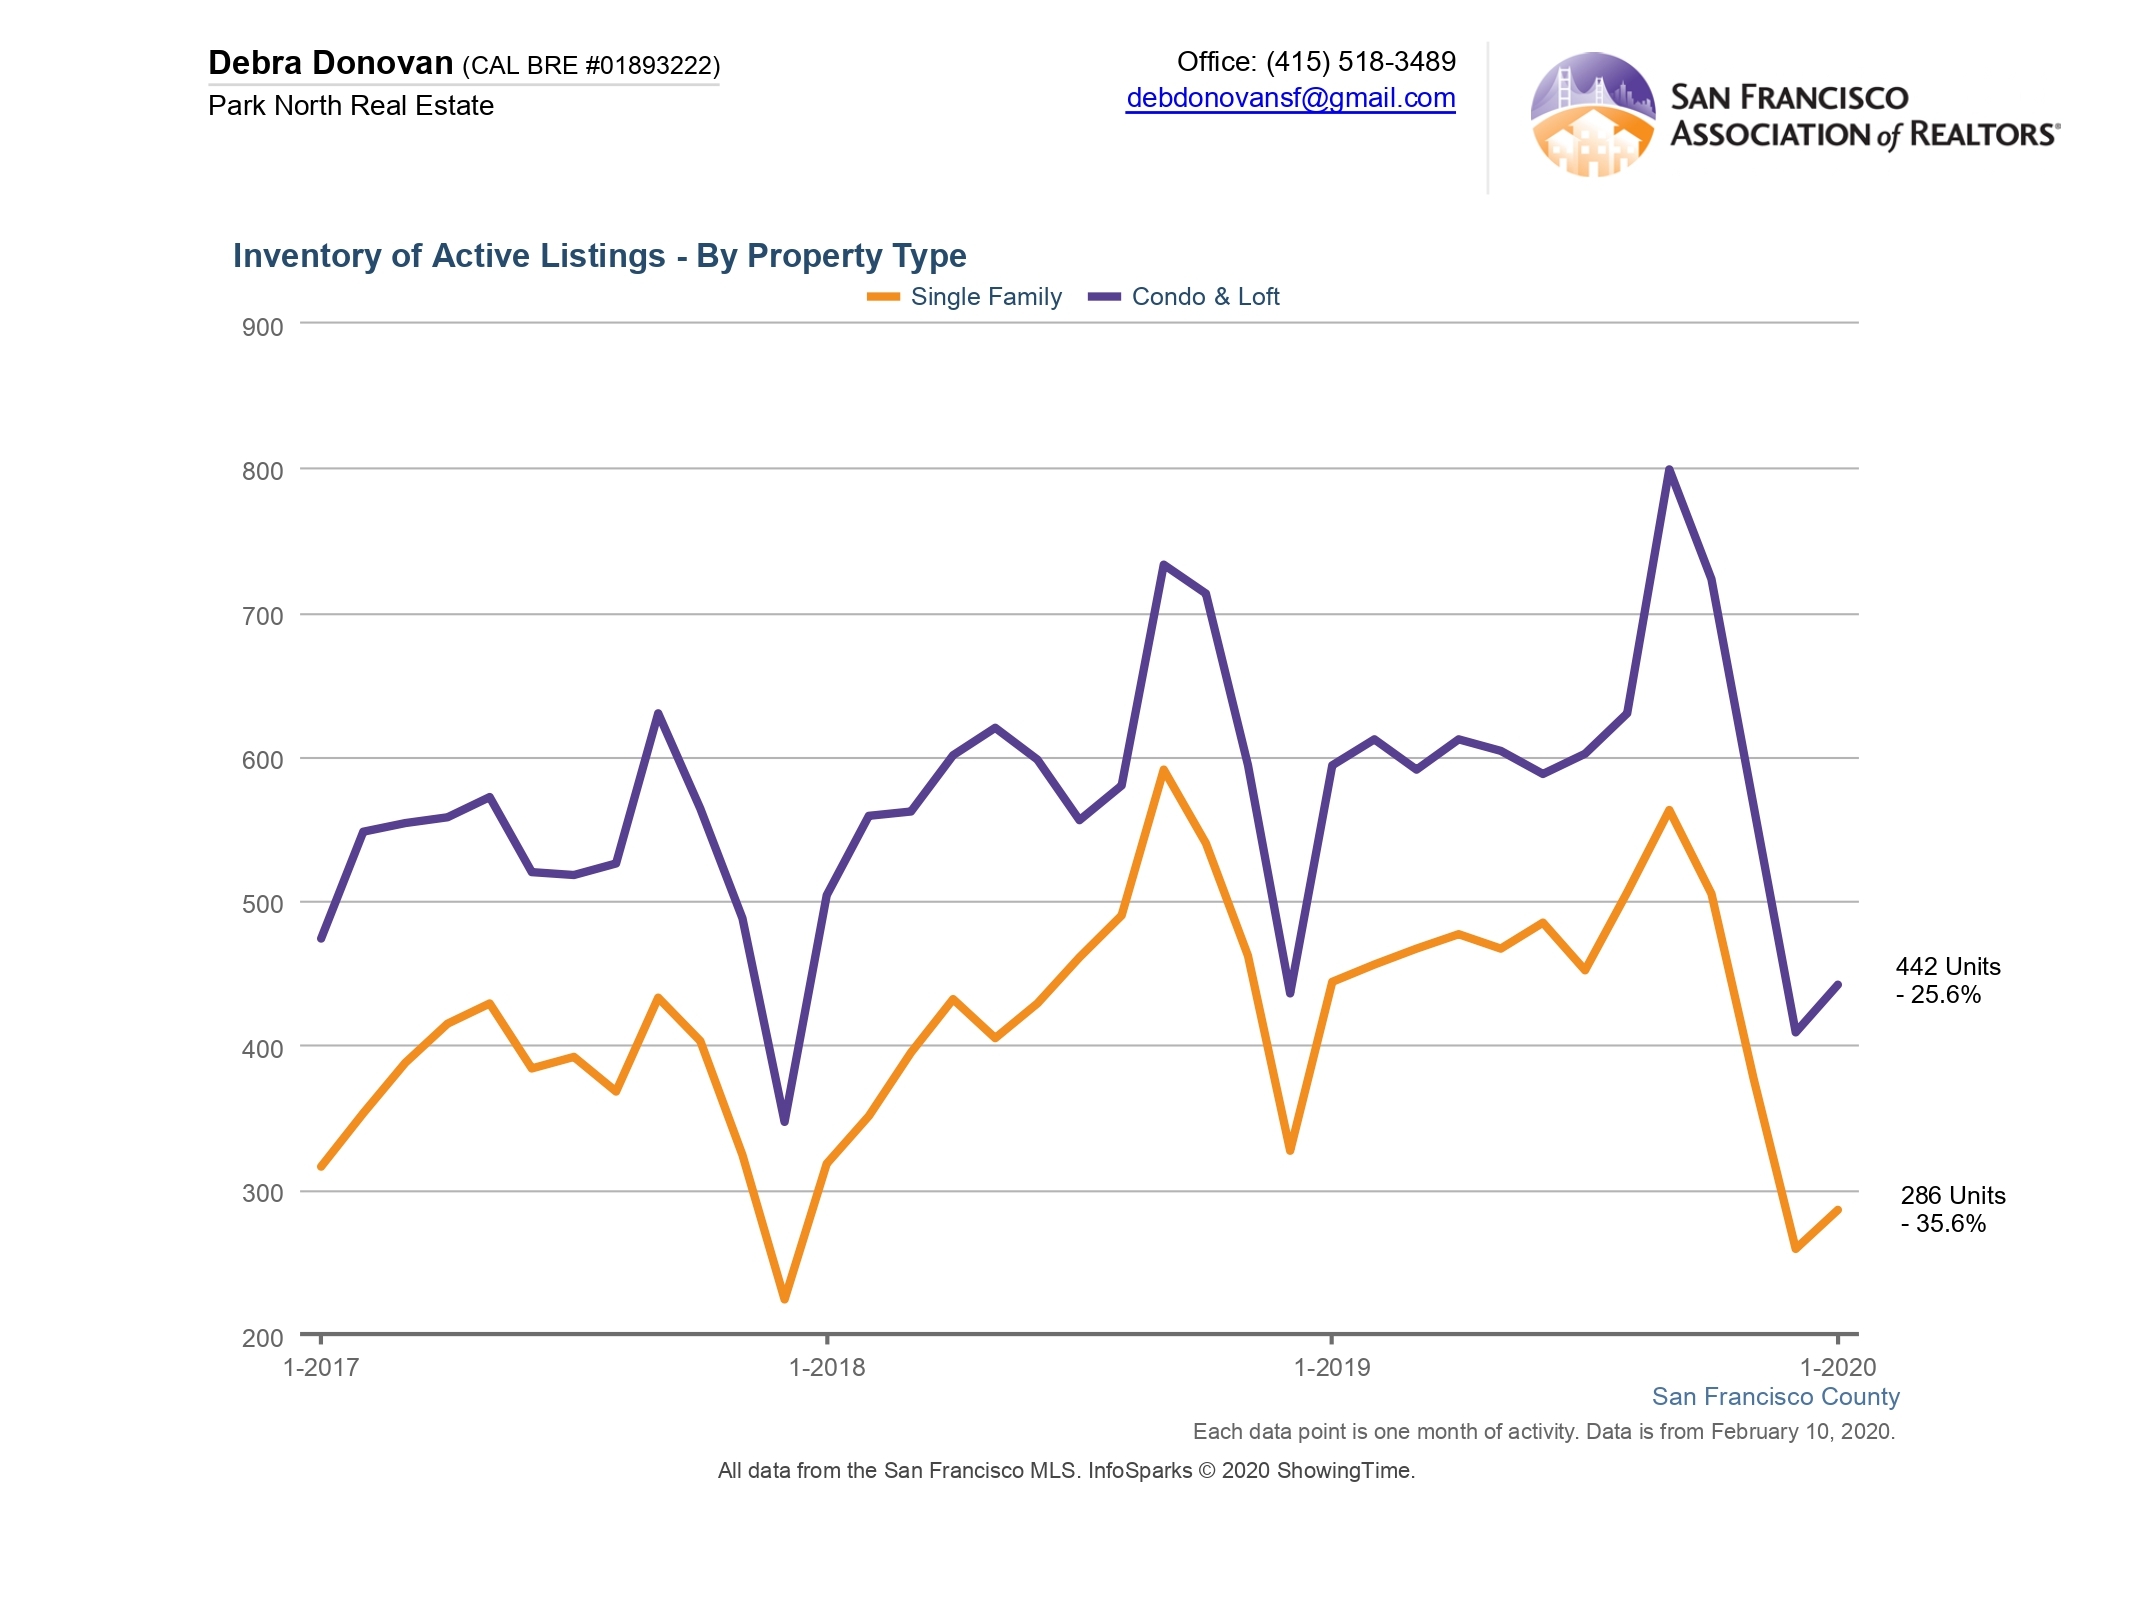
Active listings are the number of listings still available for sale at the end of the month. Active listings for single family homes grew 28% year-over-year, yet still had fewer than last month. Condos and lofts had a whopping 90% increase in July compared to the same month last year, and slightly more listings compared to last month. Again it’s difficult to compare apples-to-apples considering the unique seasonality of the market in 2020 due to the health crisis, but condo inventory has grown exponentially over the past few months. Buyers are clamoring for outdoor space and more room as more people plan to work from home long-term, and thus many buyers are eyeing the single family home market more.
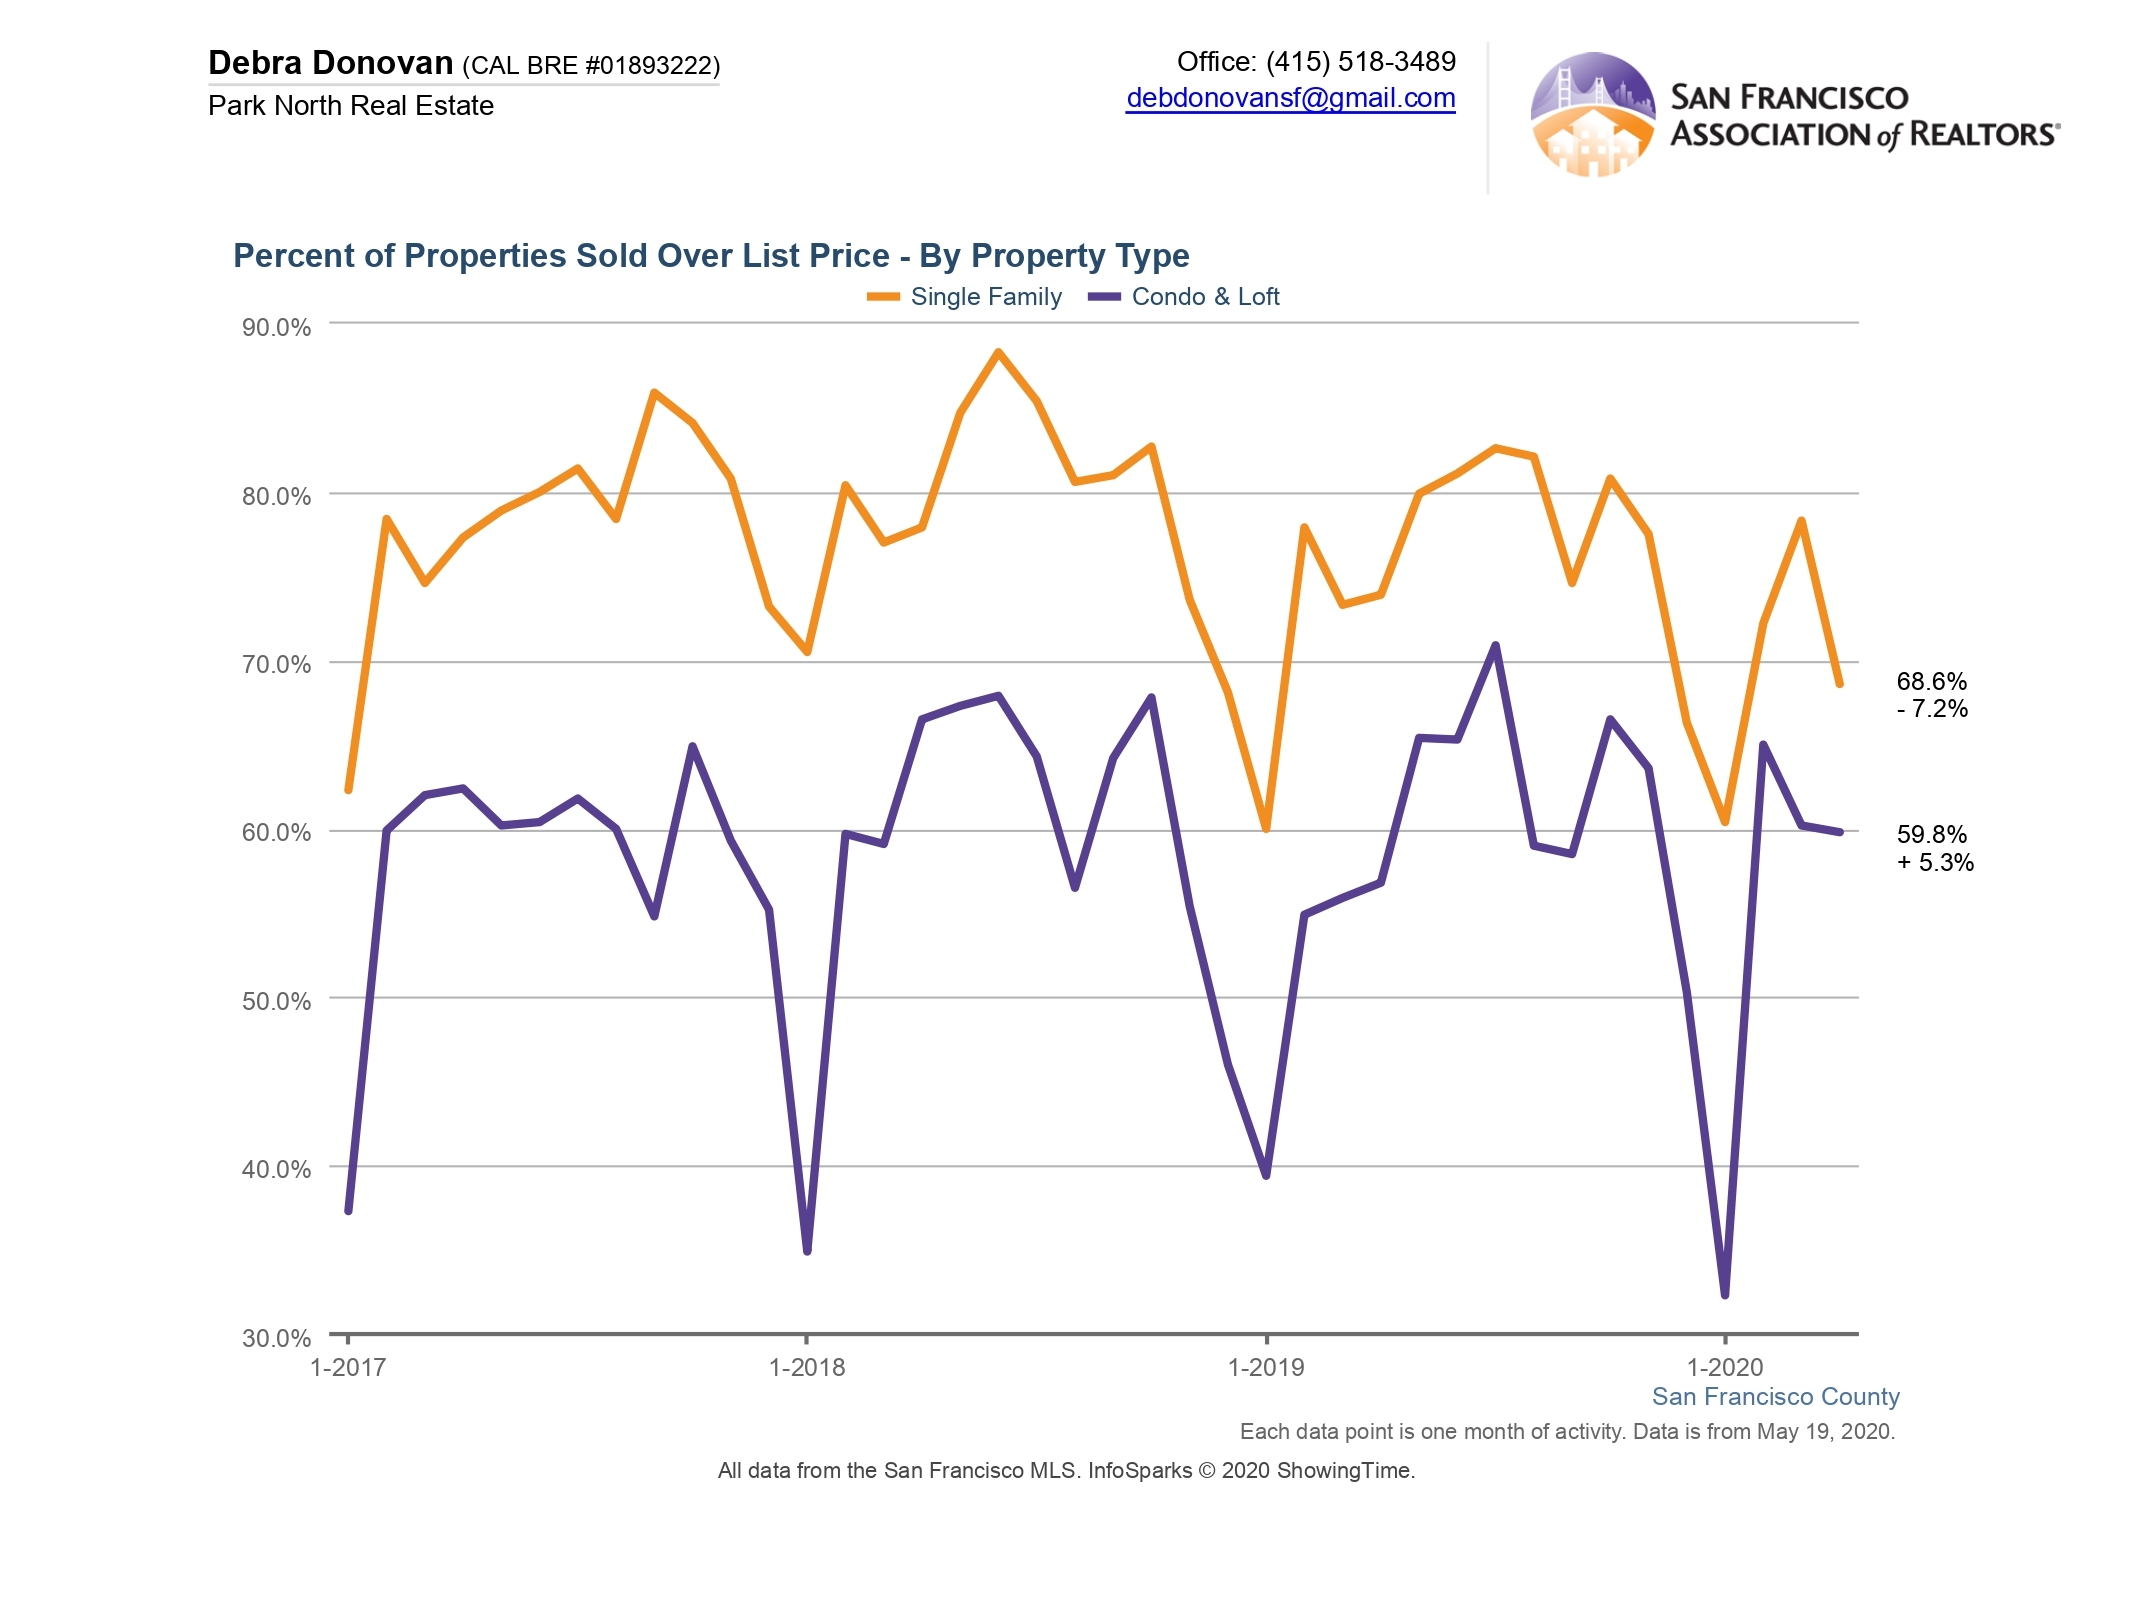
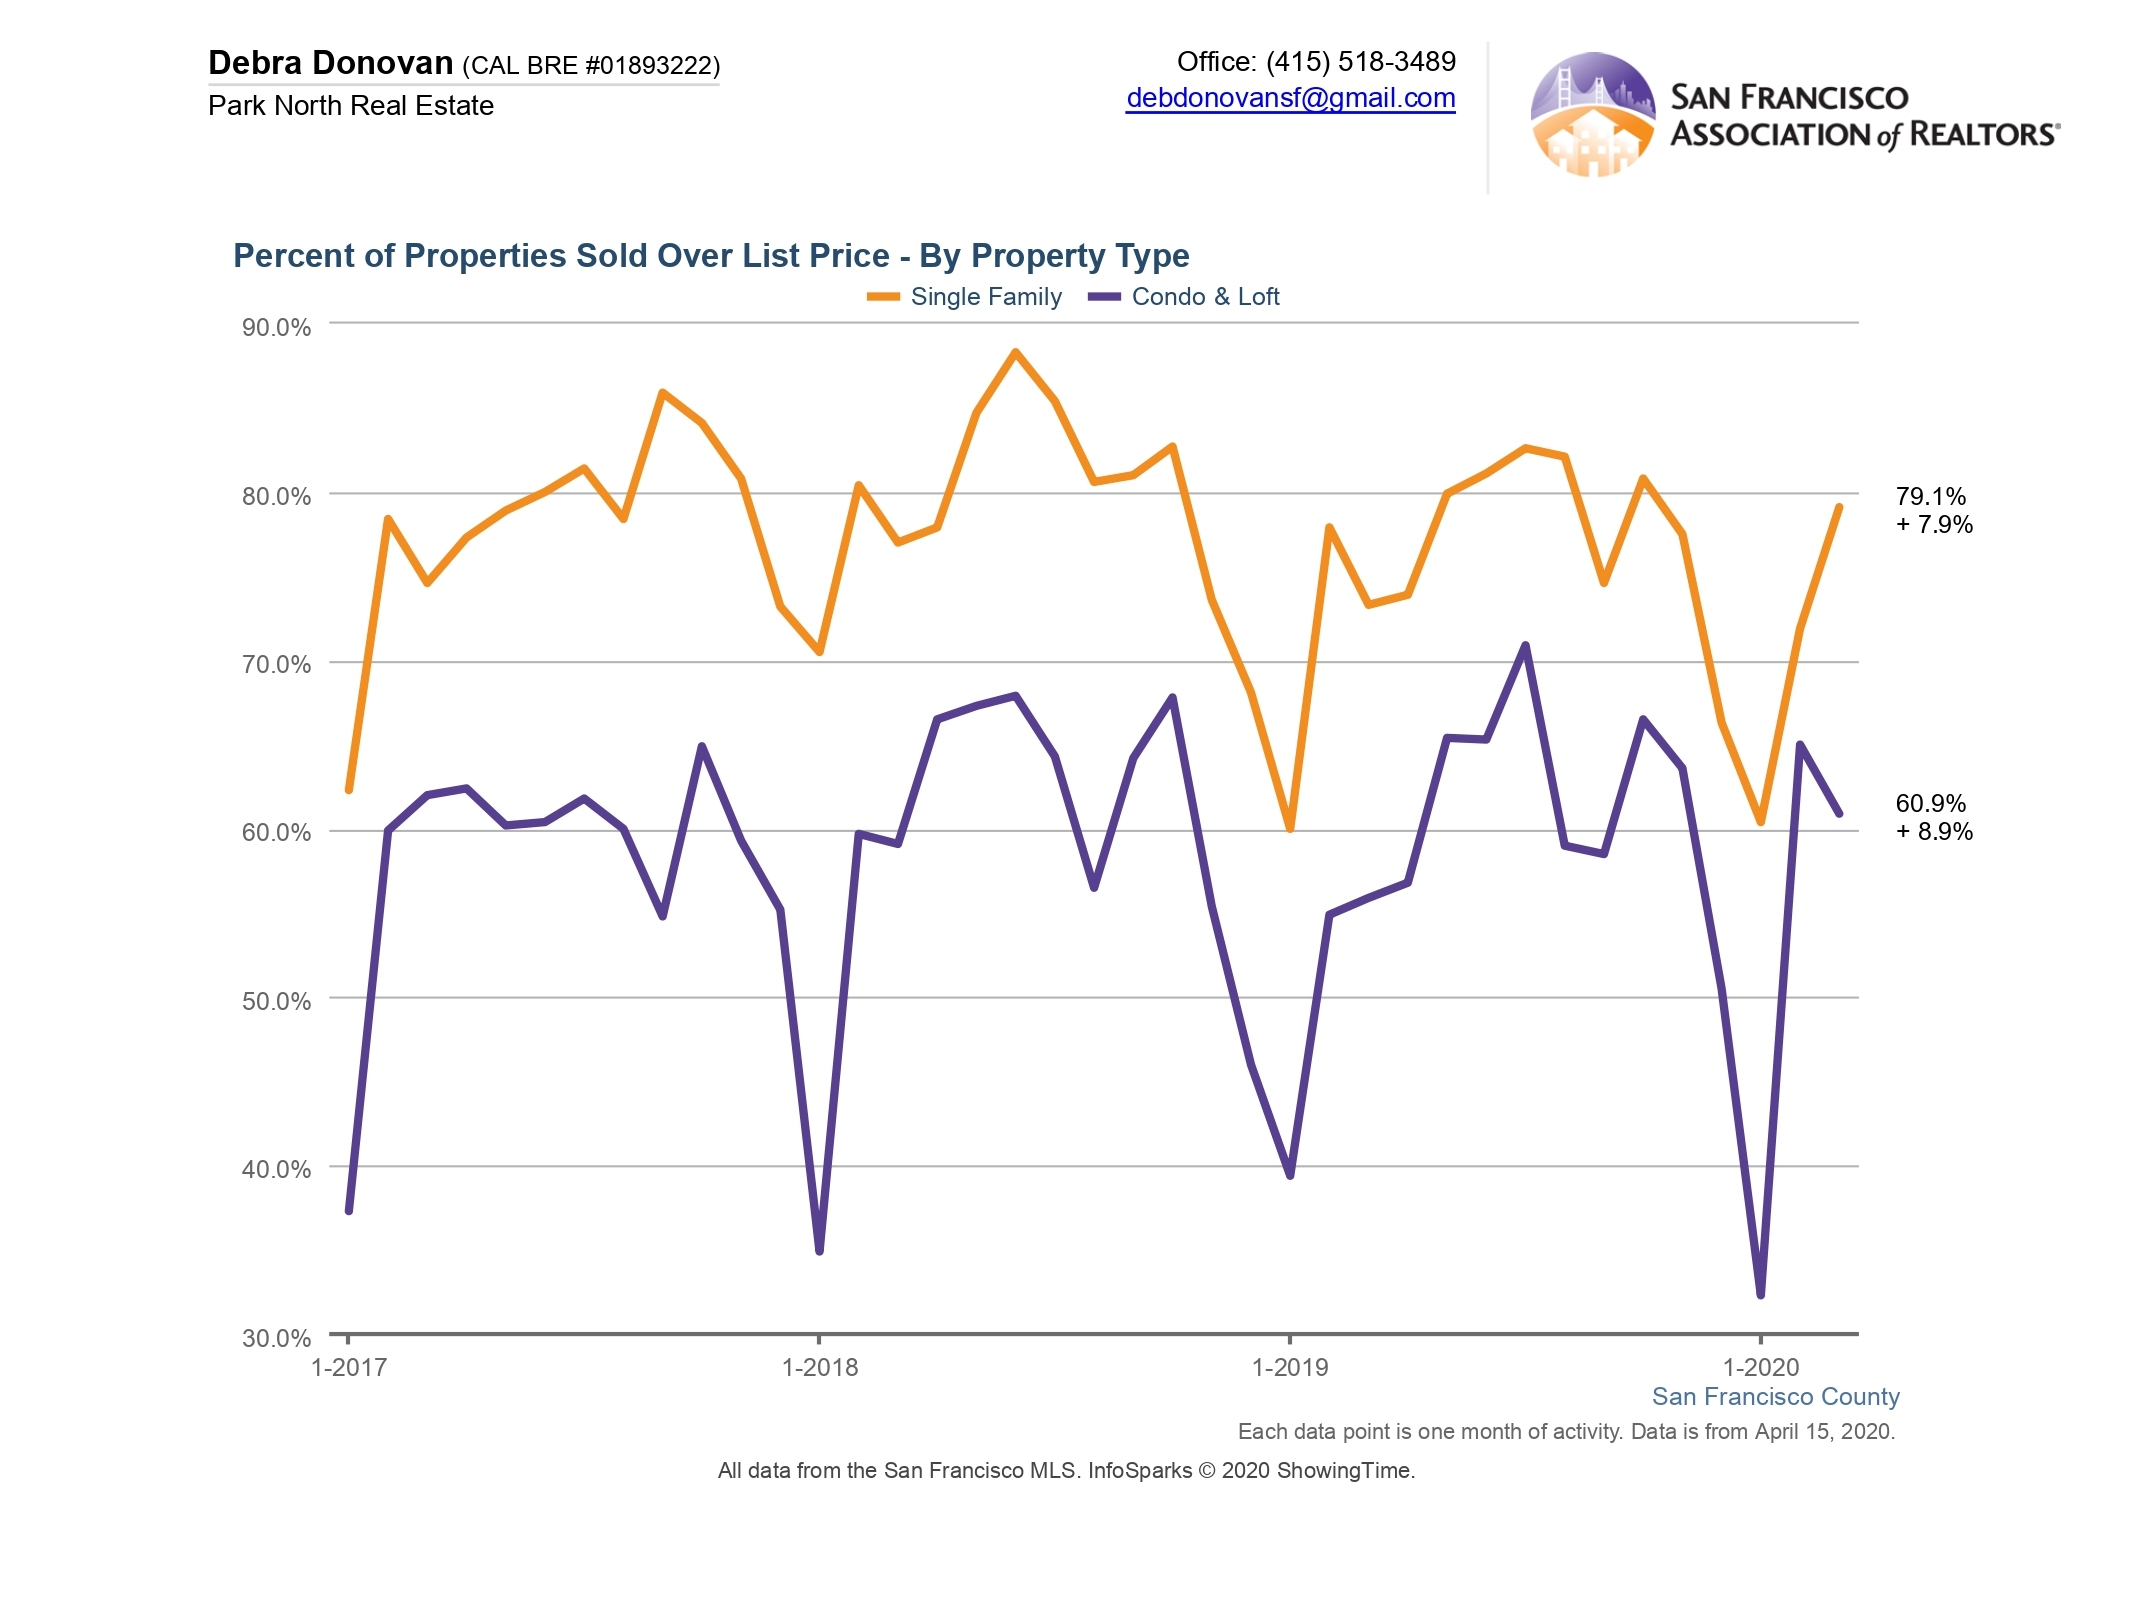
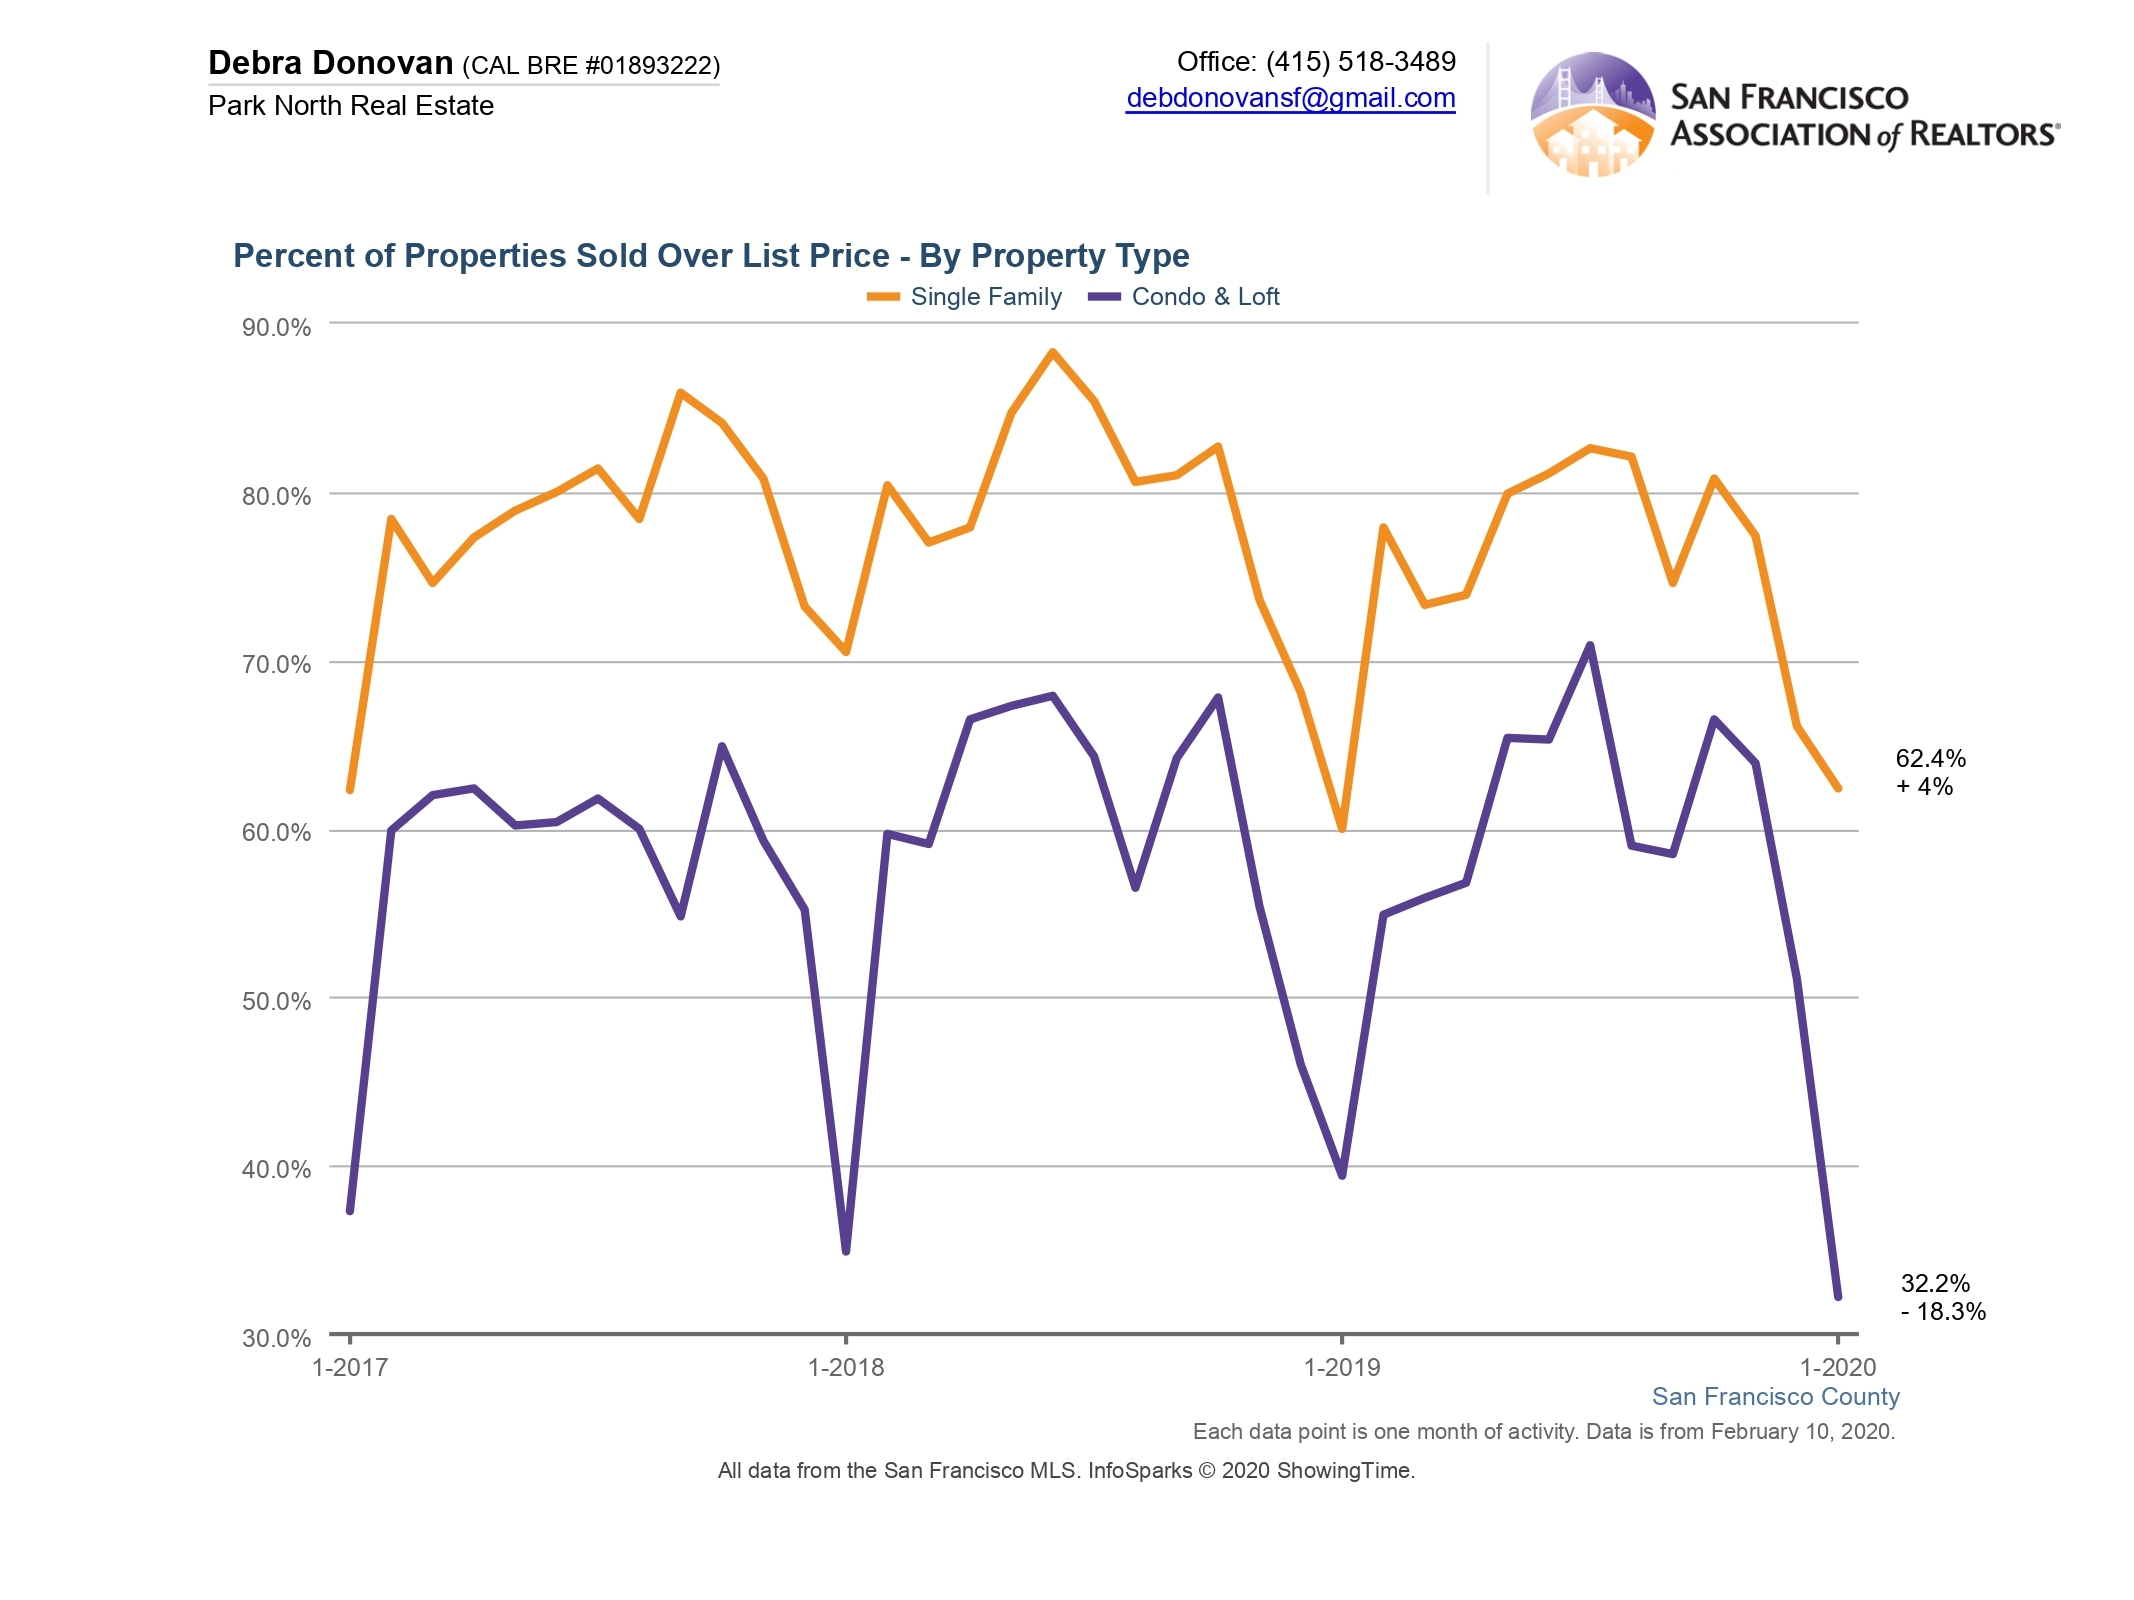
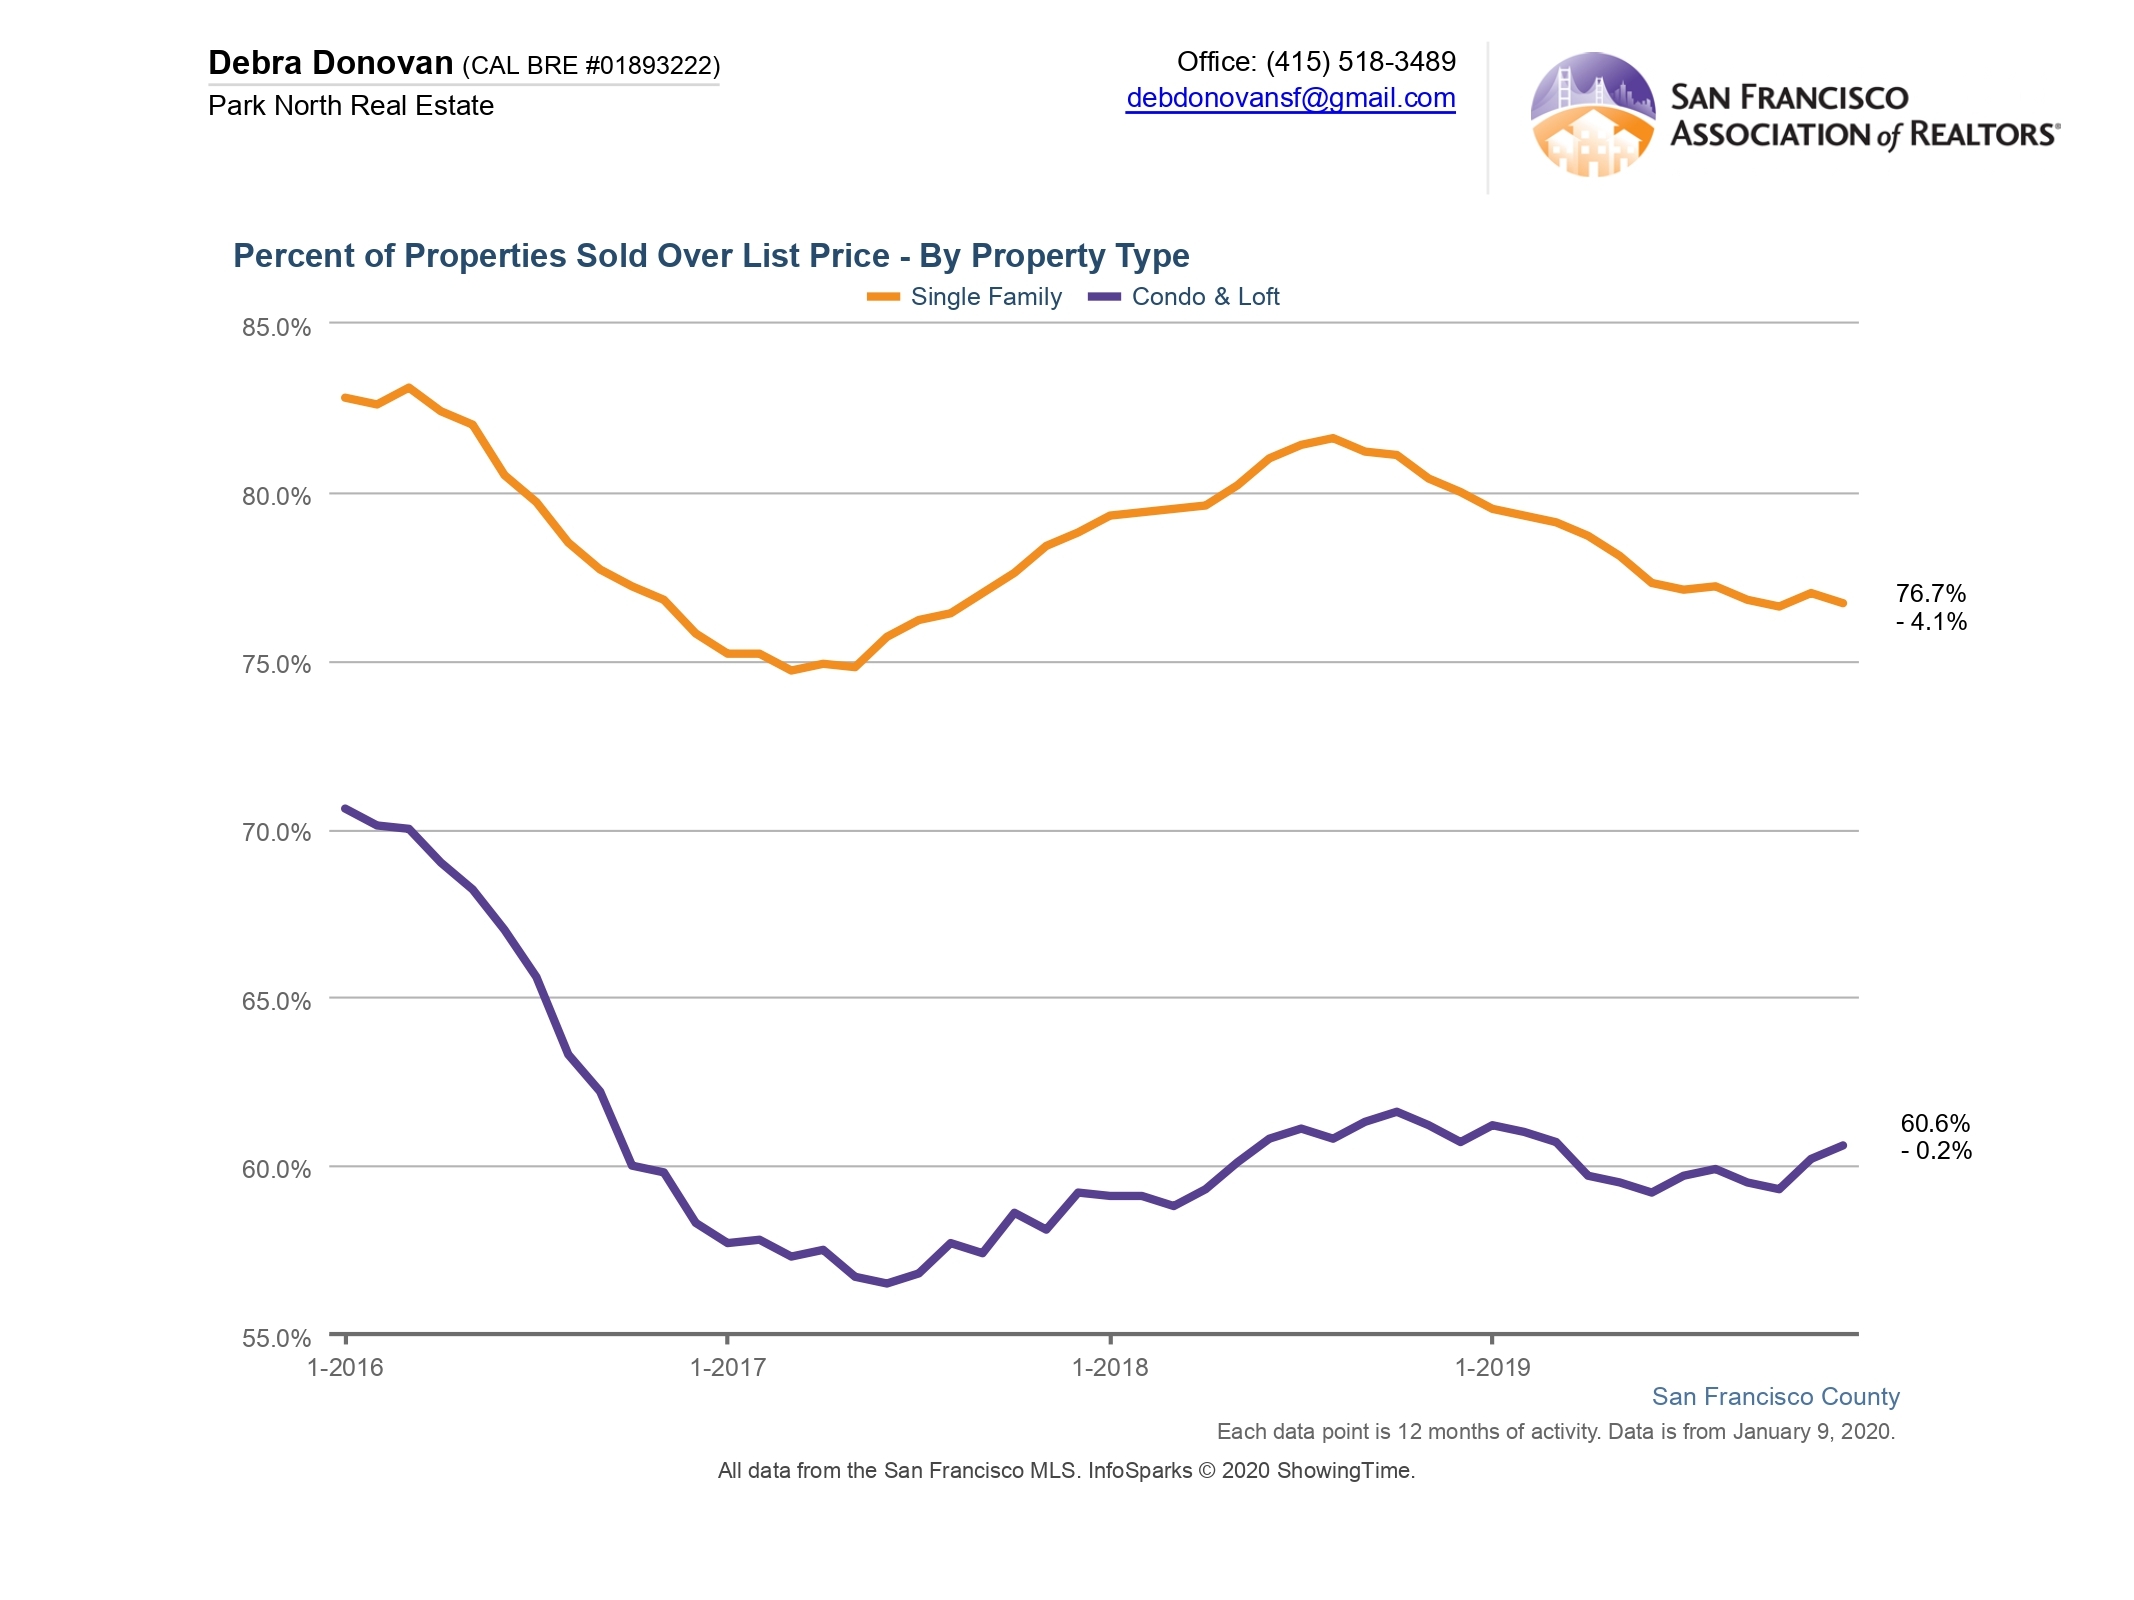
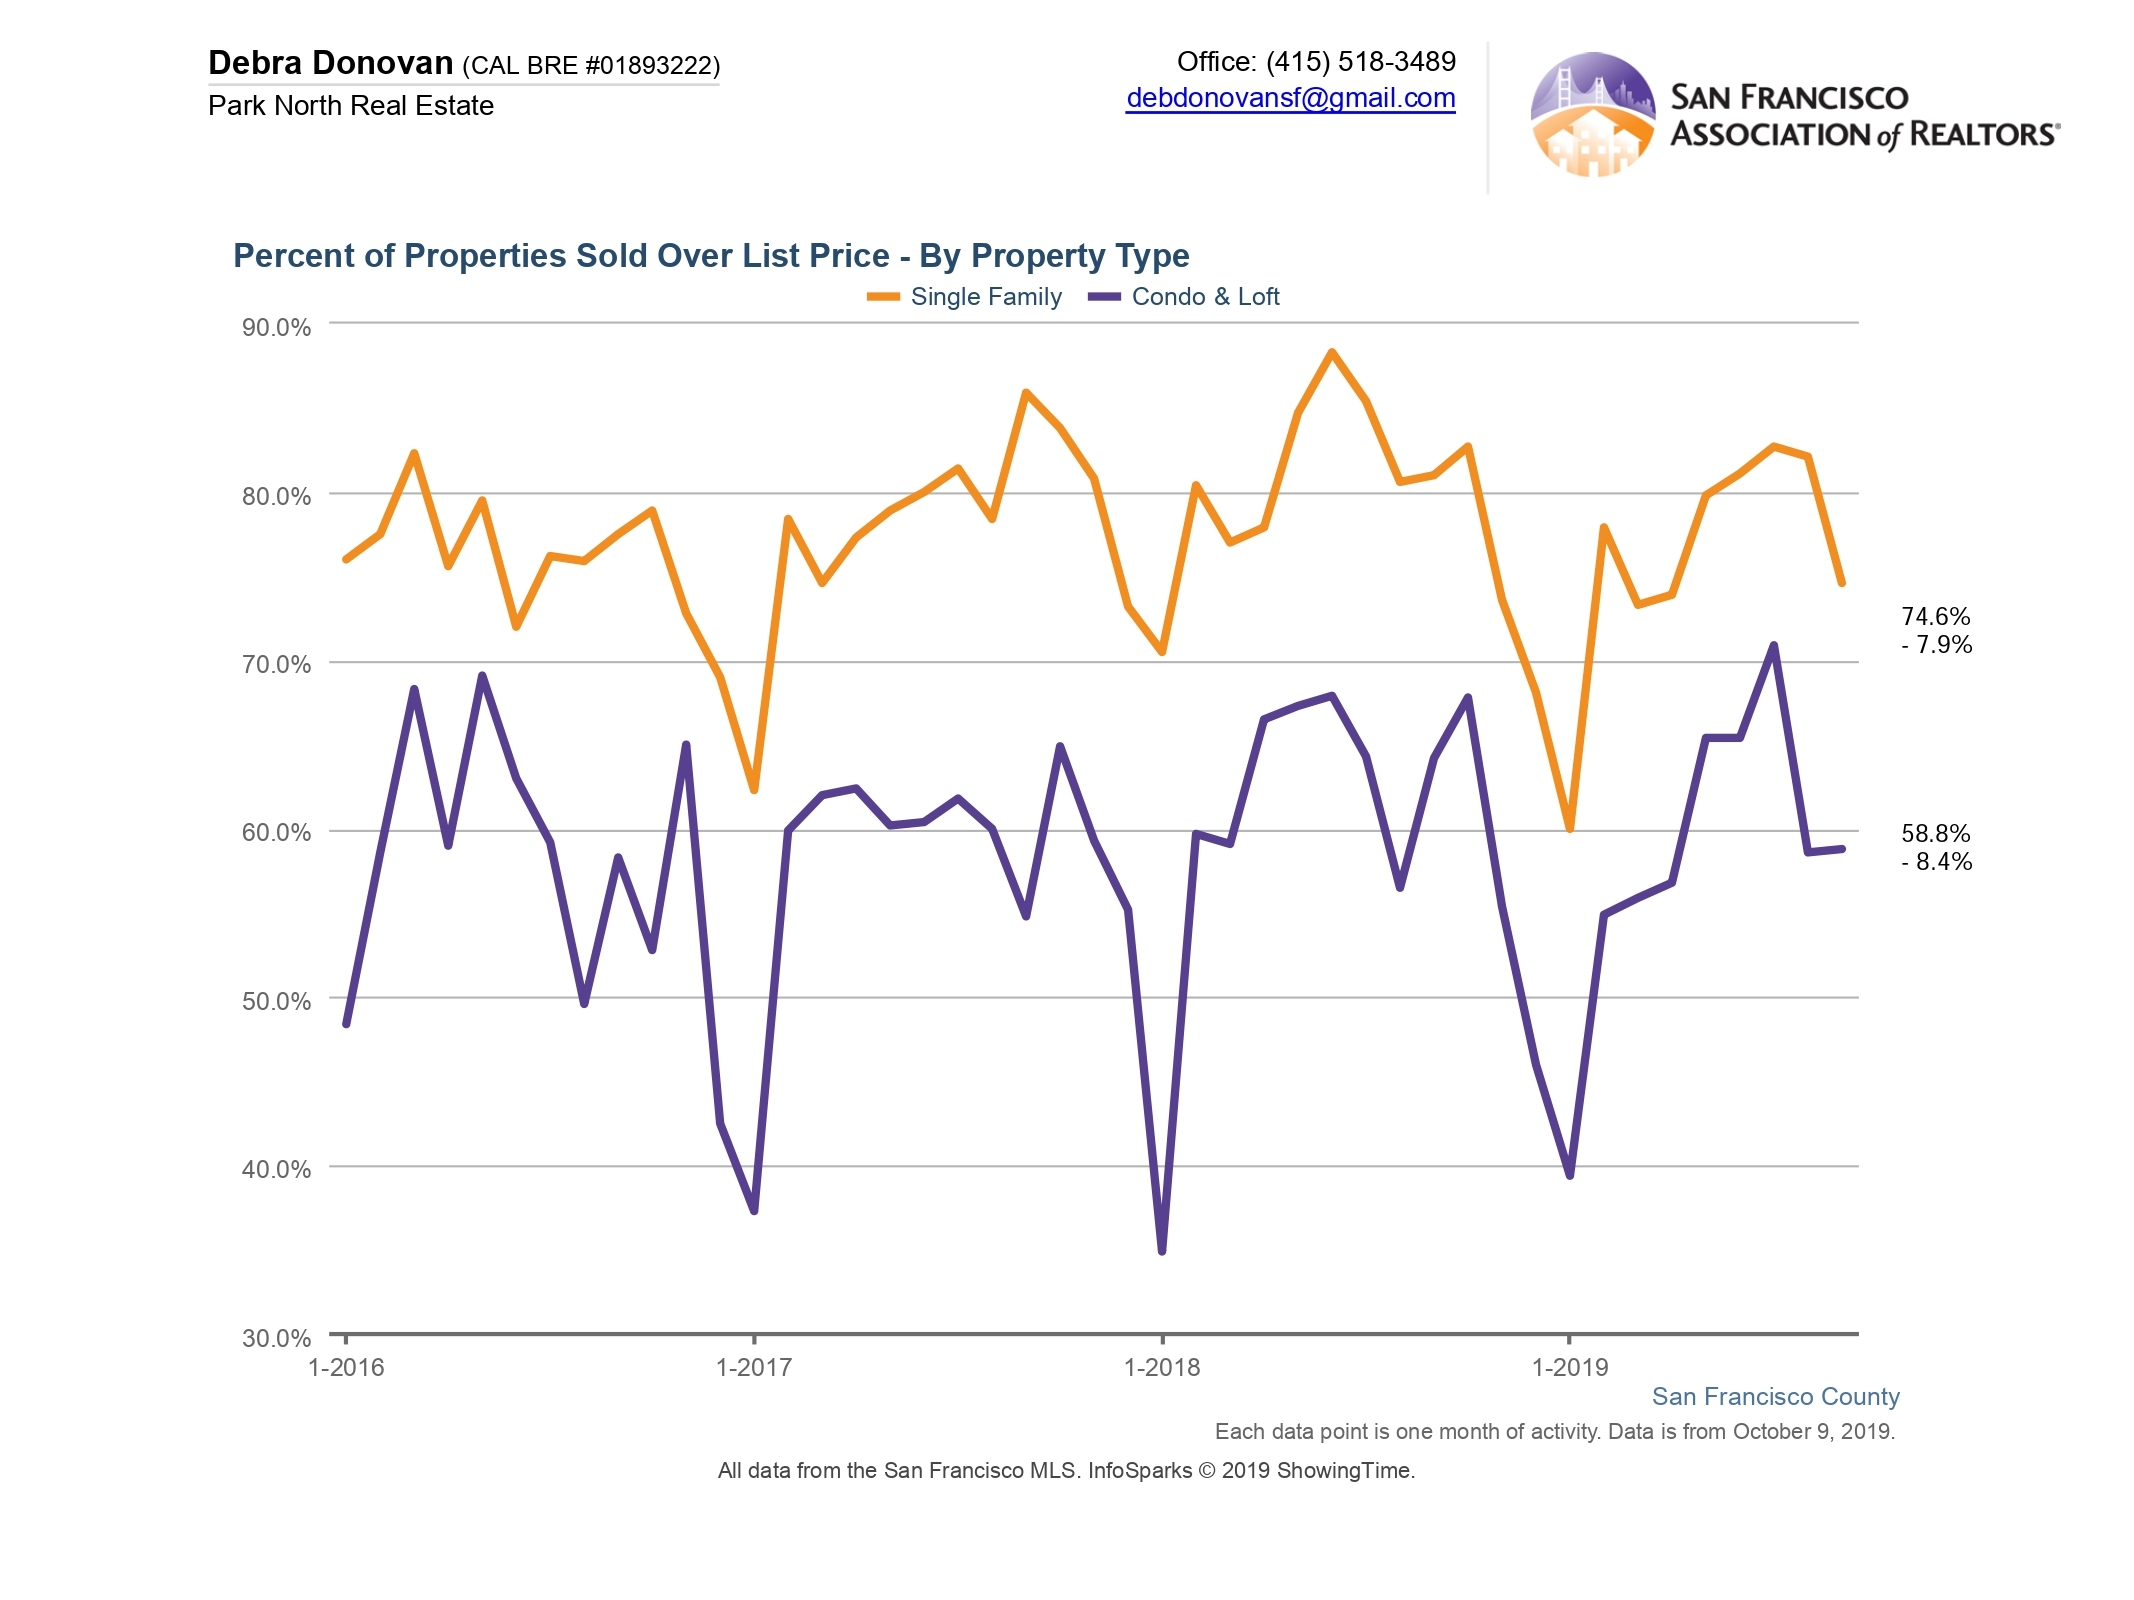
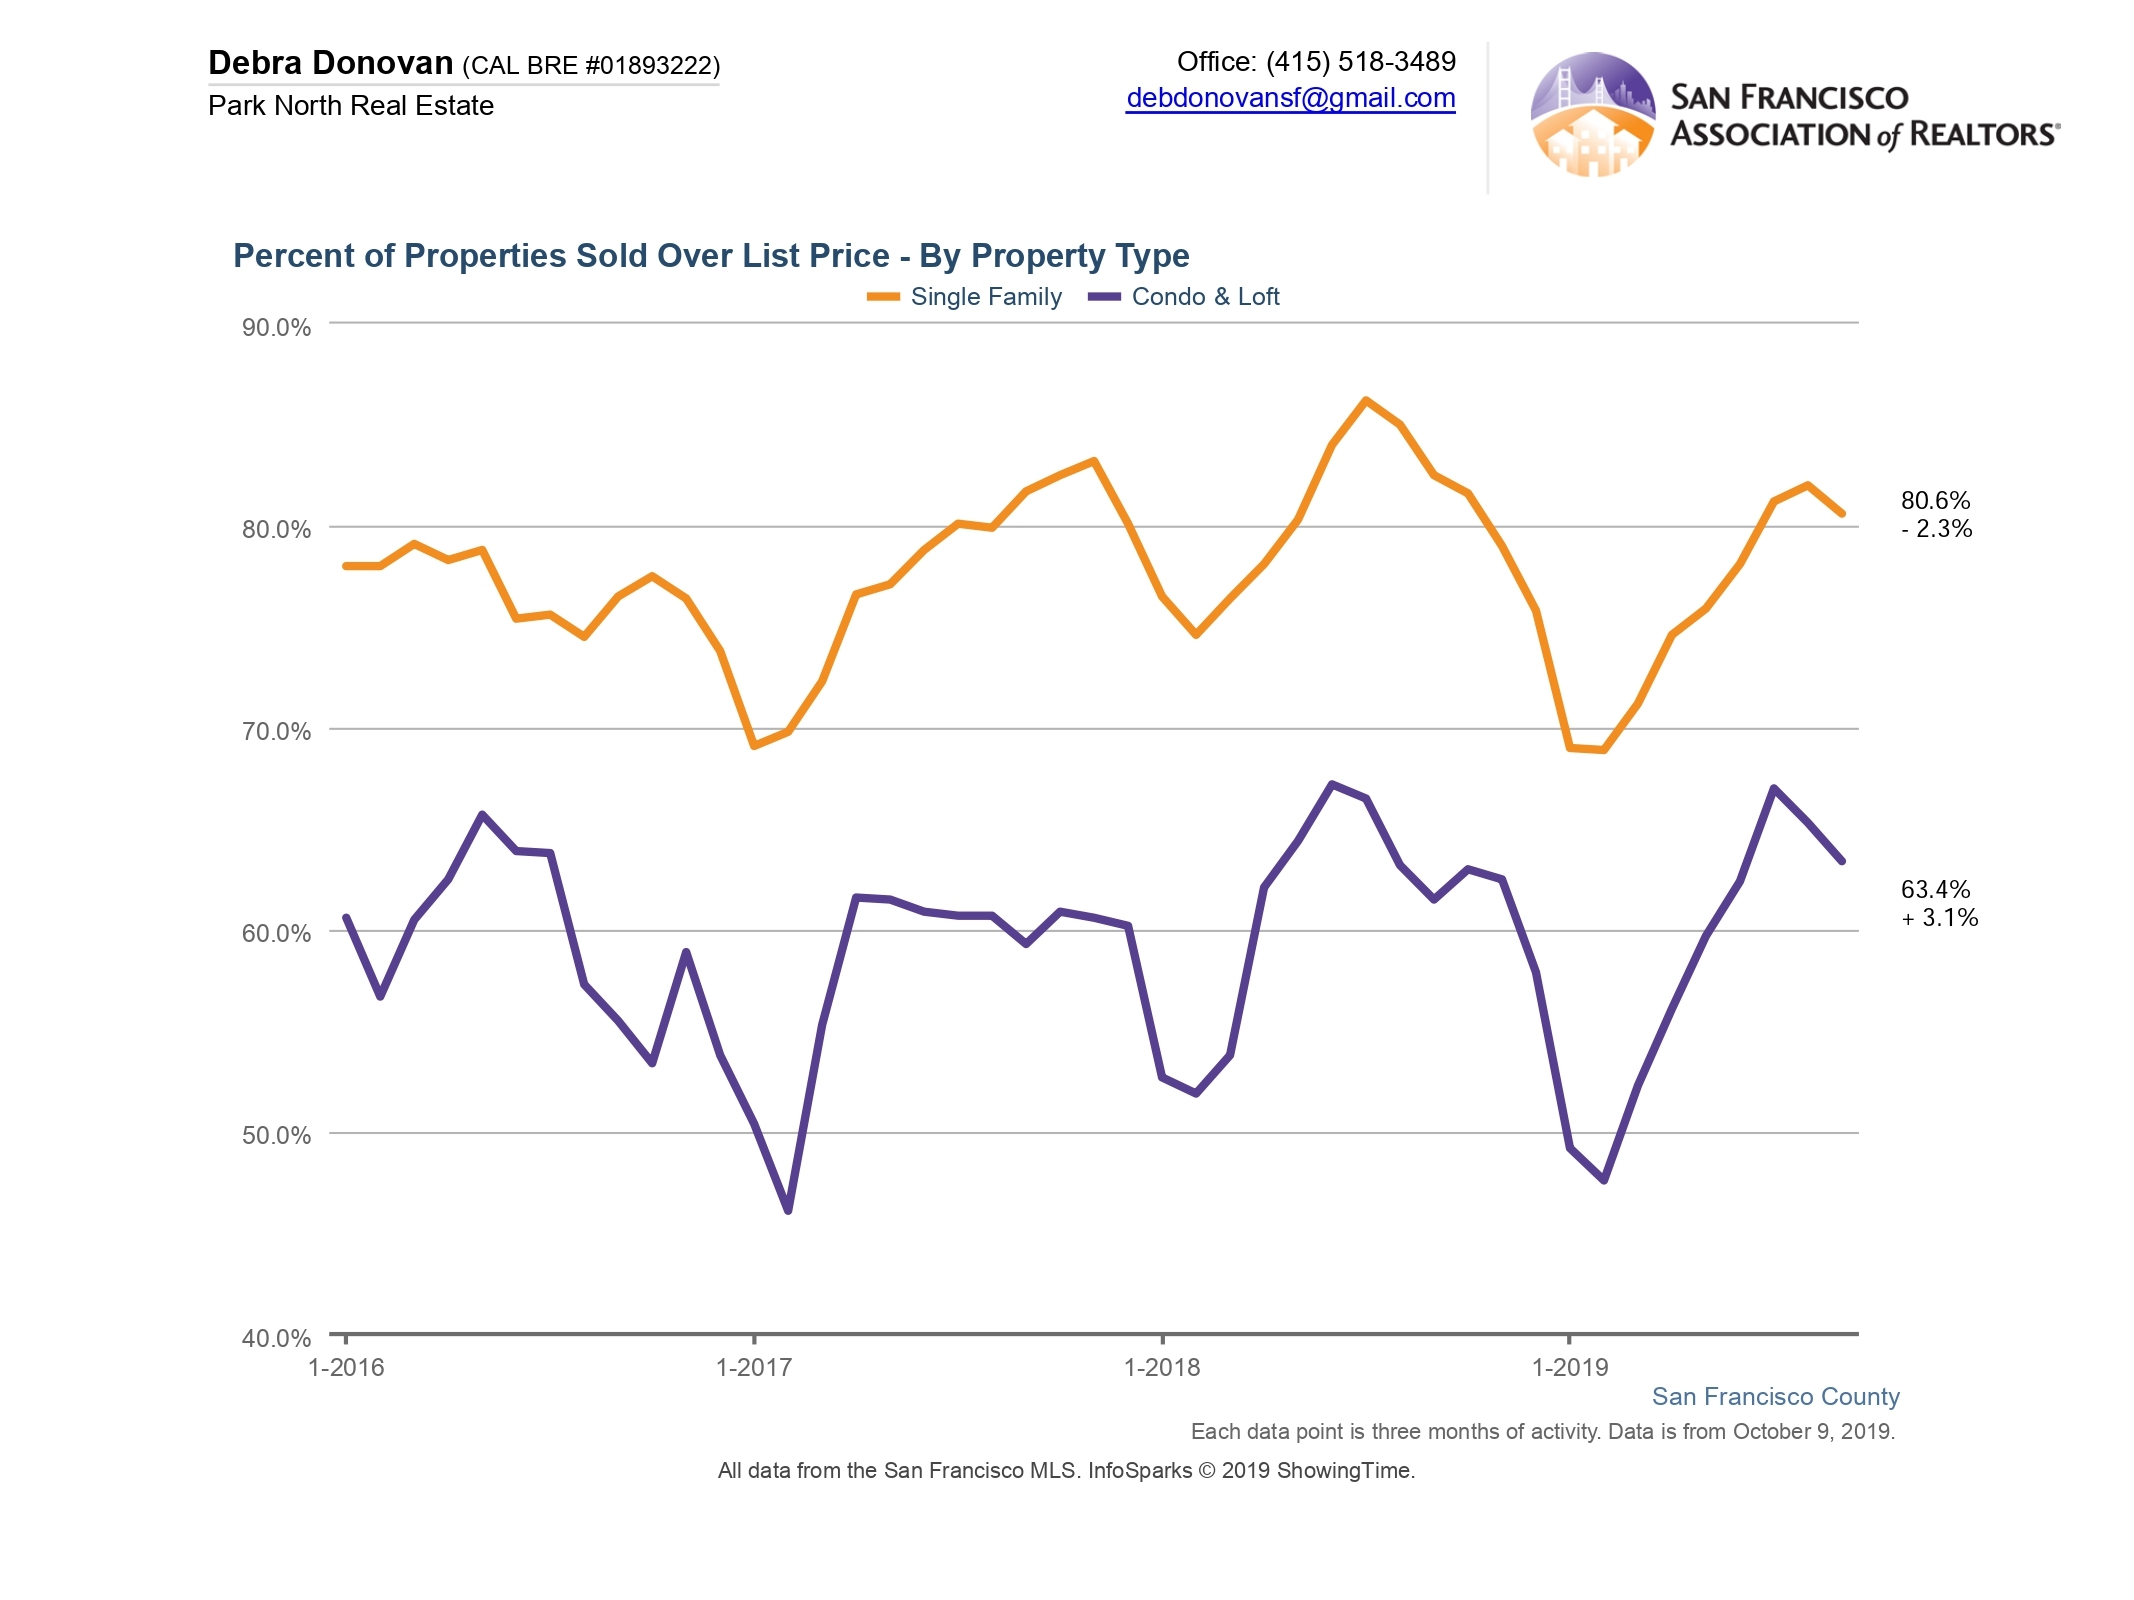
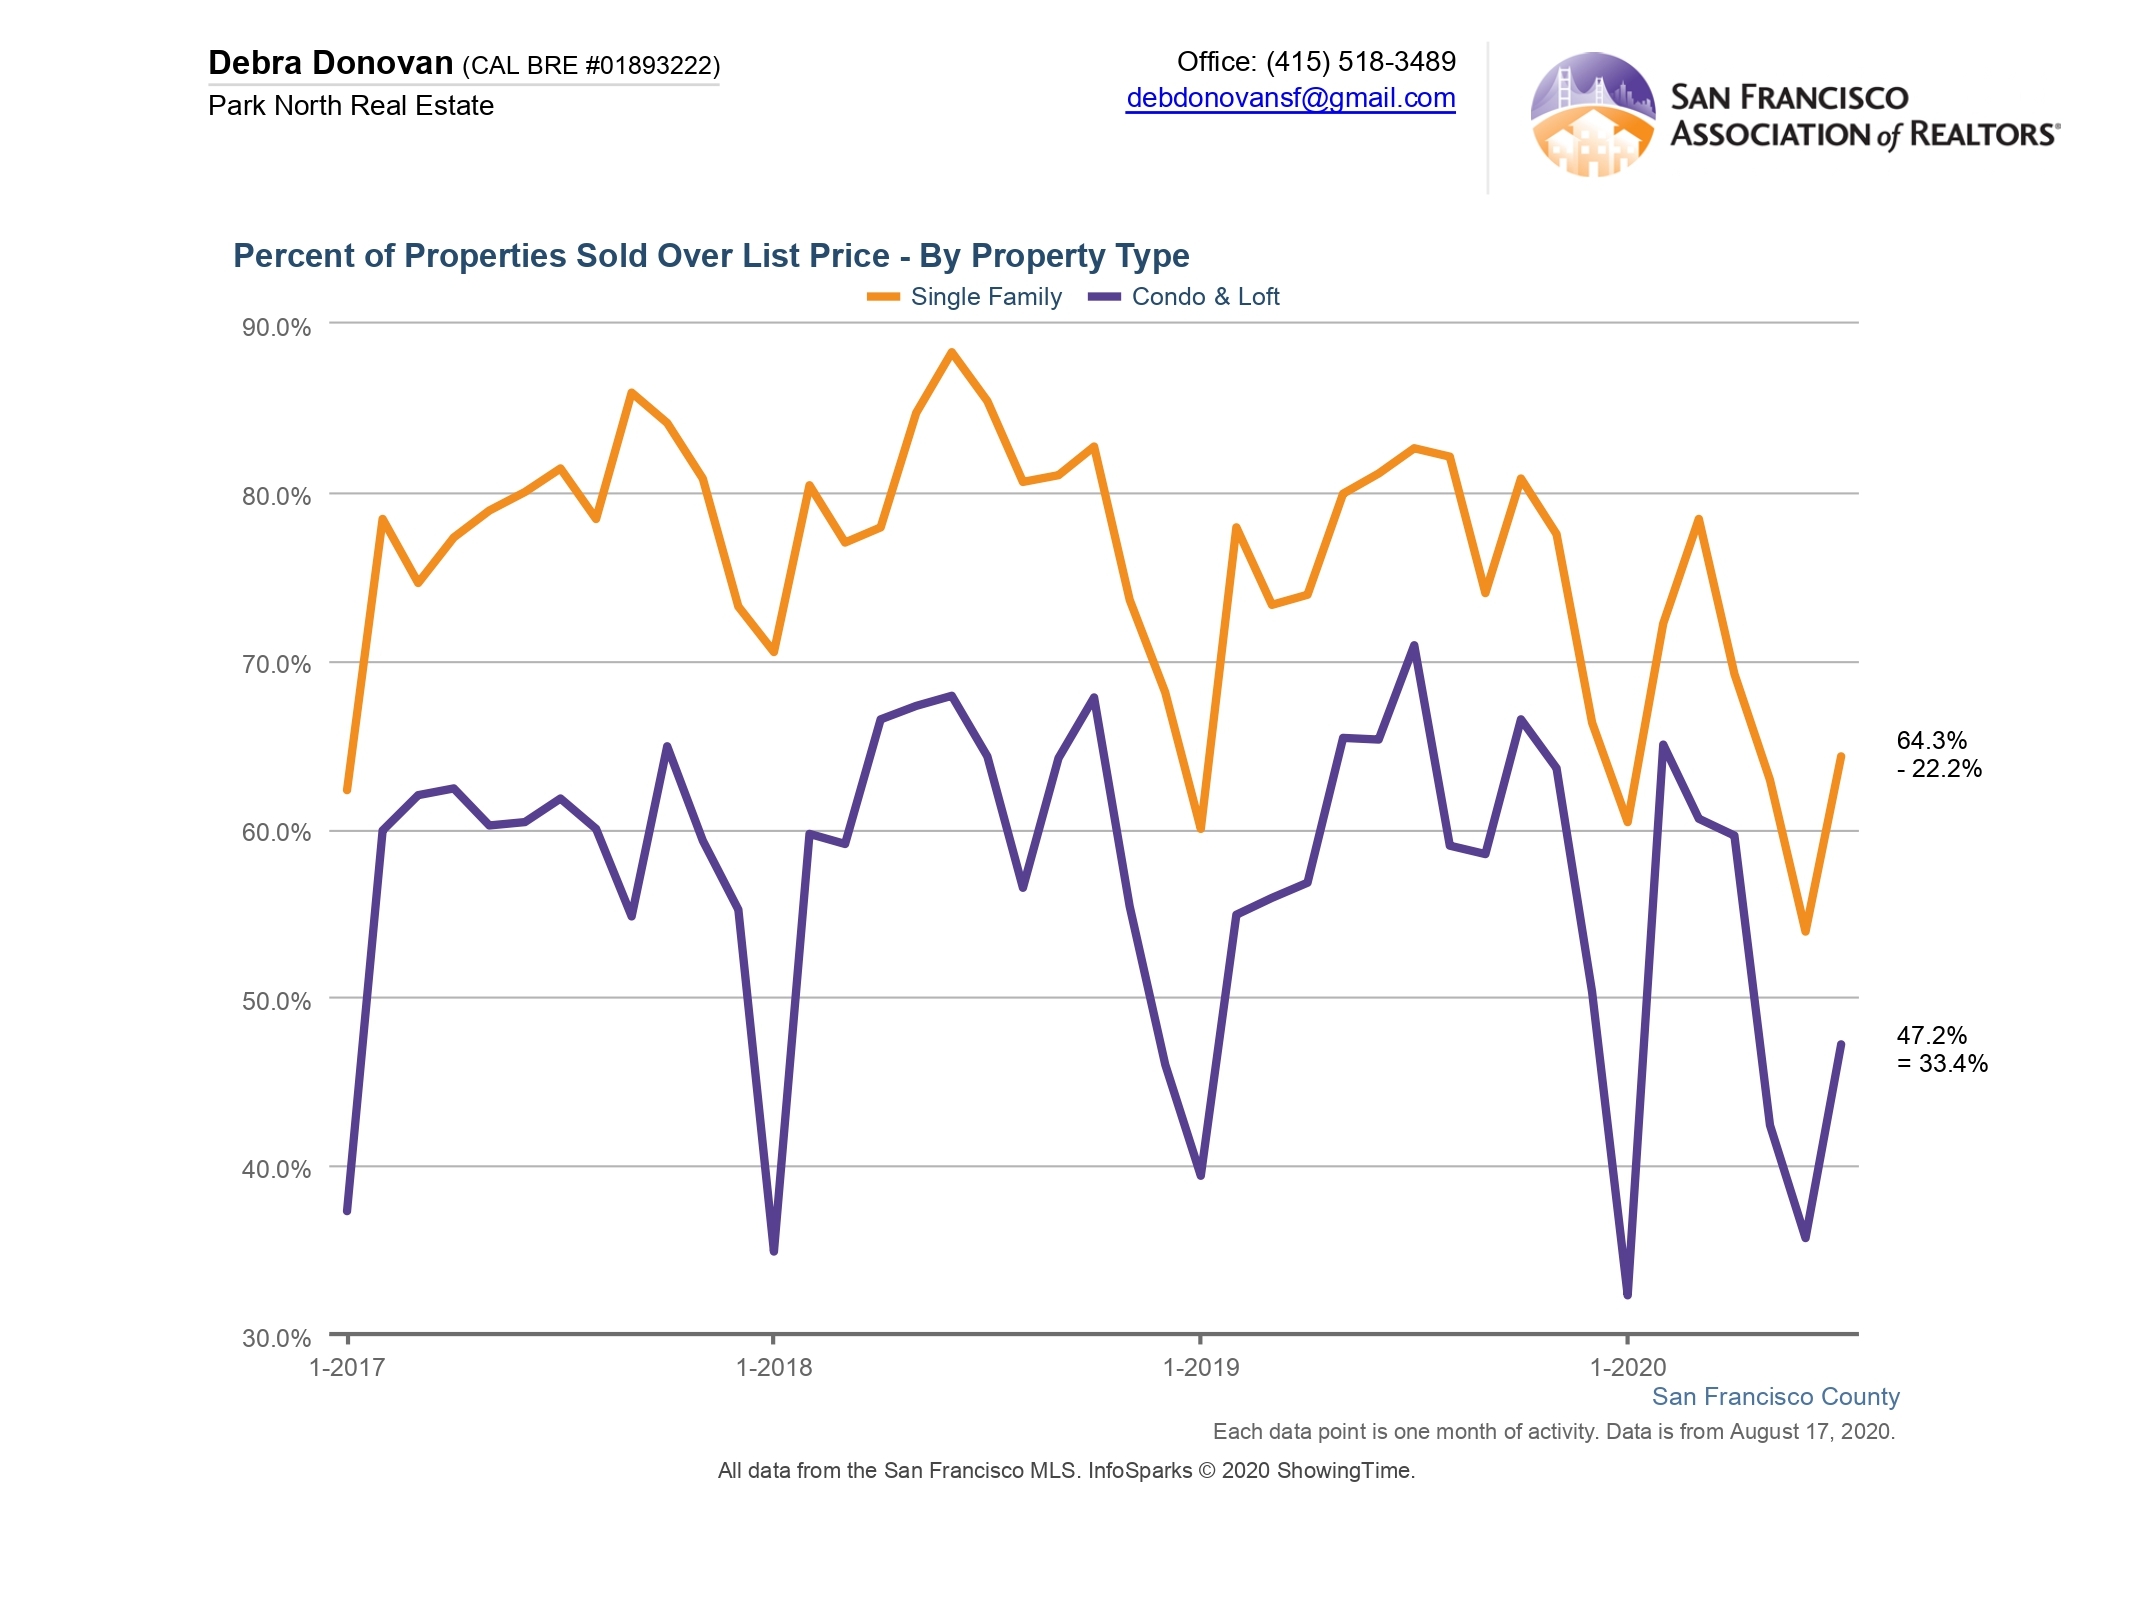
Percentage of Properties Selling Over List Price:
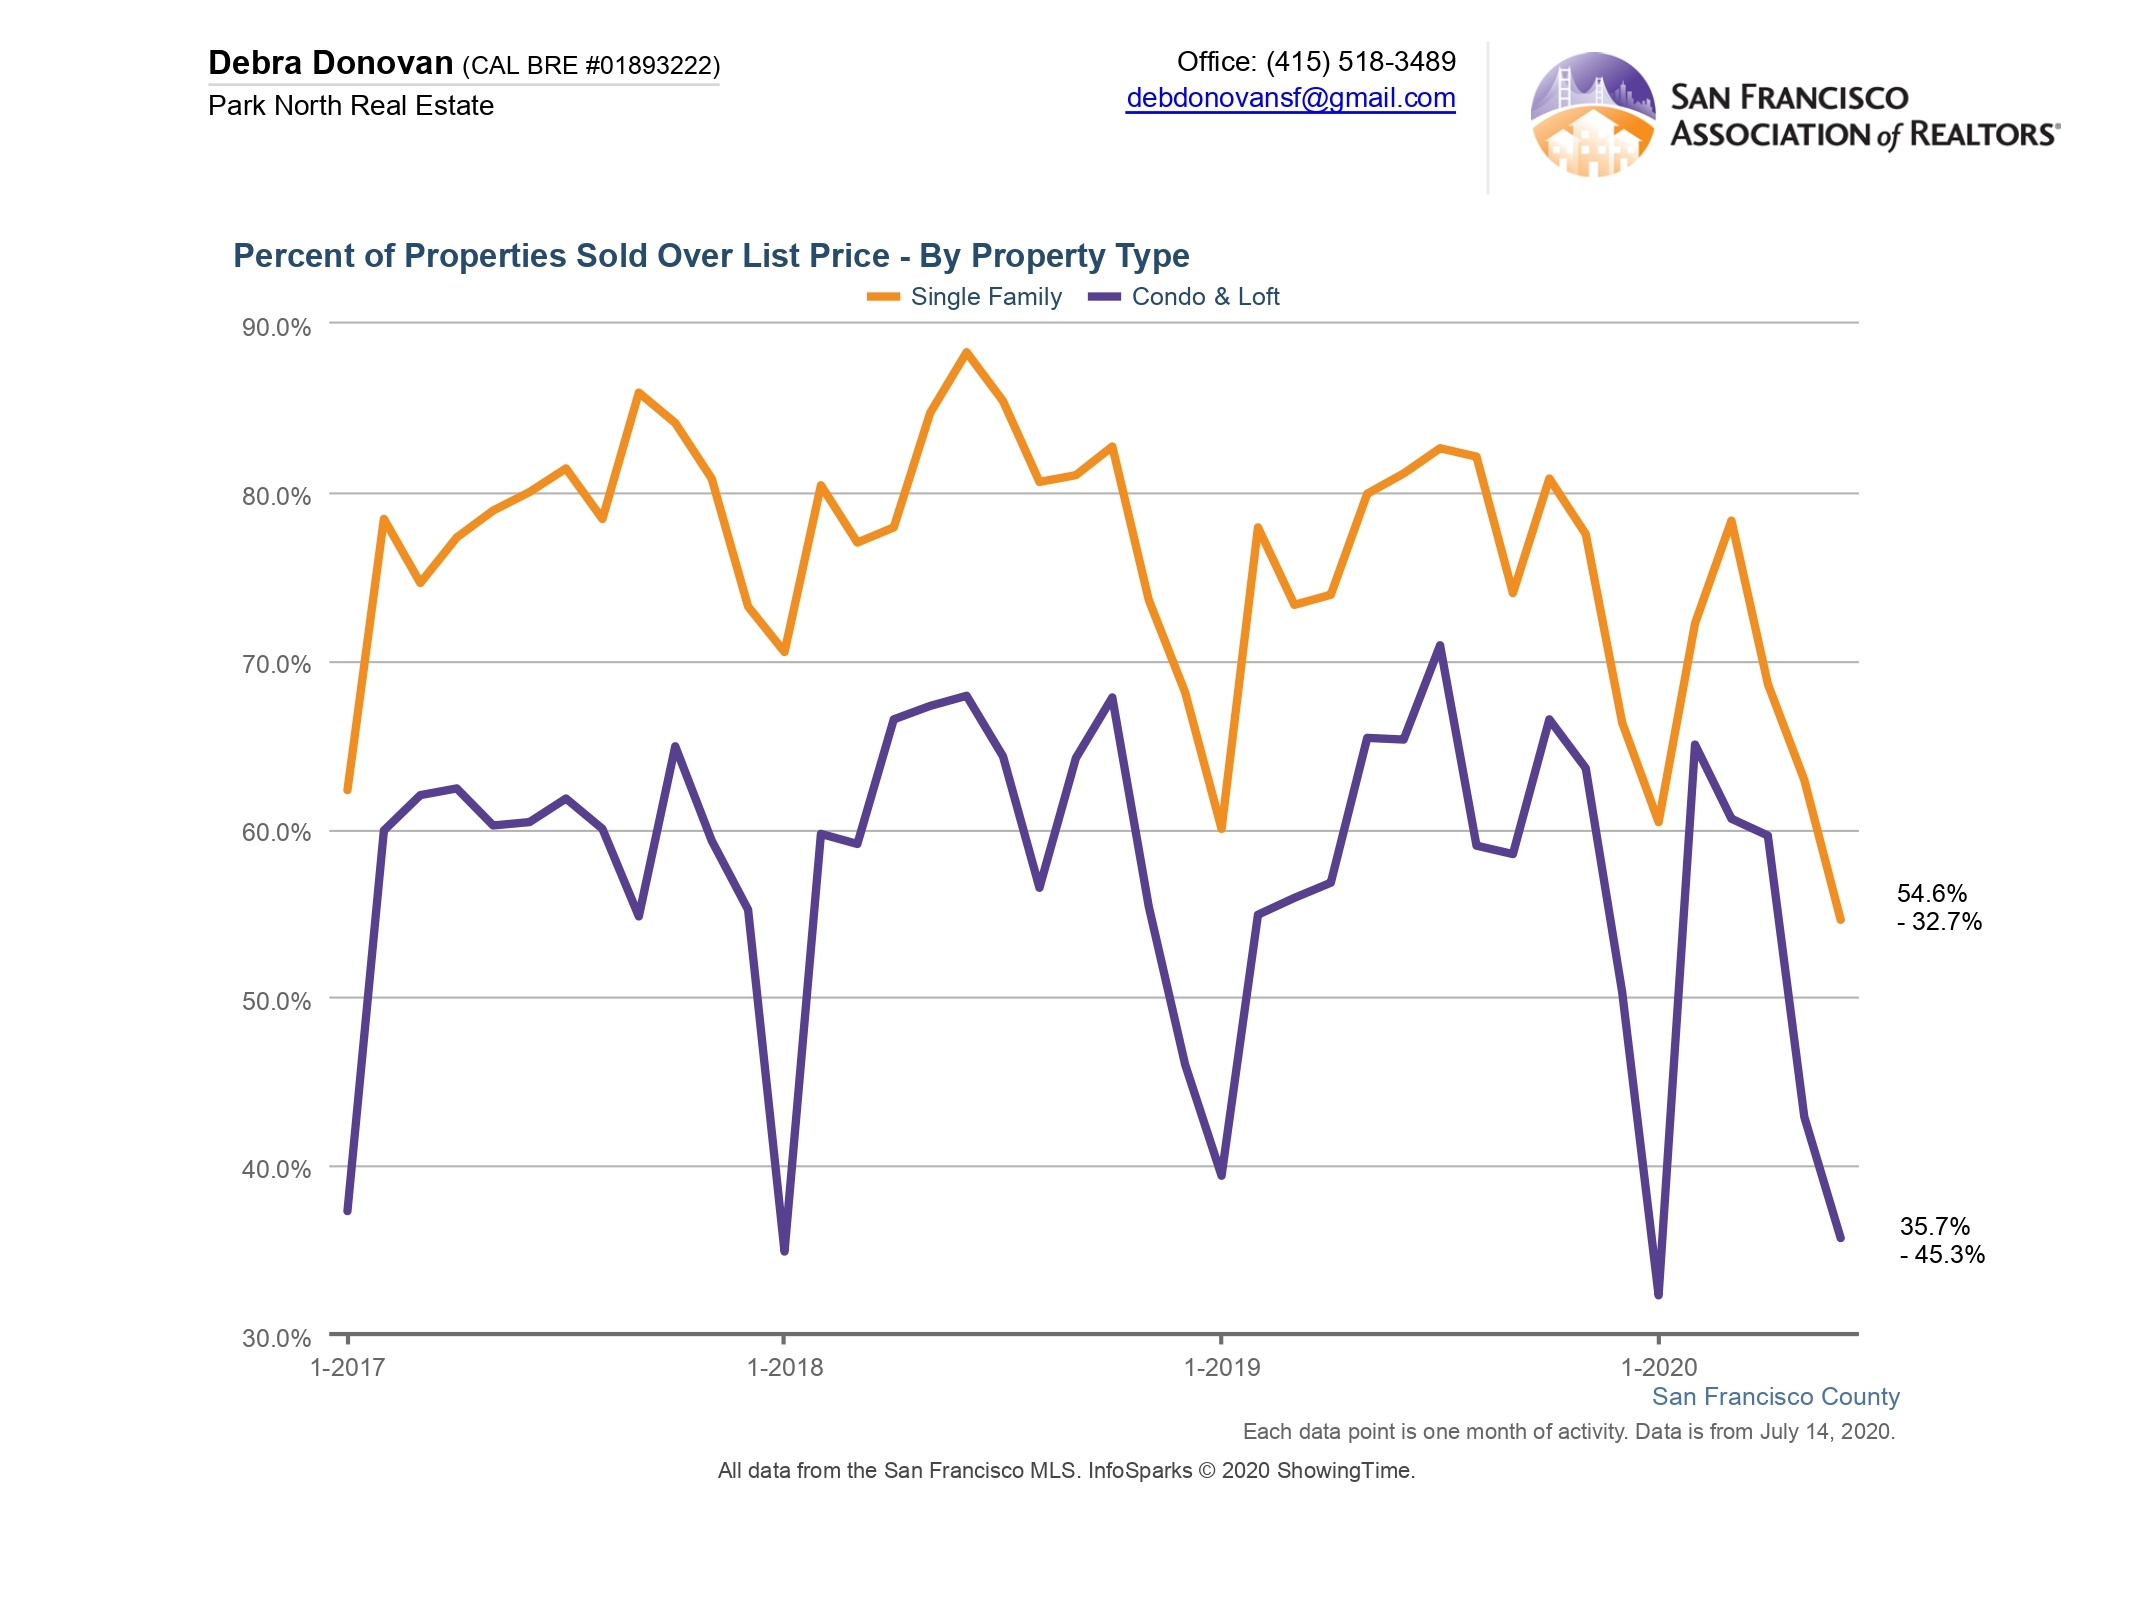
In spite of what you may be hearing in the media and other places, many properties are still selling over their list price, though most not as stratospherically as we’re used to seeing in San Francisco. In July 64% of single family homes sold for more than their listing price, while 47% of condos and lofts did. But both are down compared to the same month last year, 22% and 33% respectively. This is likely due to the lift in inventory (buyers have more to choose from), as well as more “transparent pricing;” properties are being priced closer to their actual valaue from the get-go.
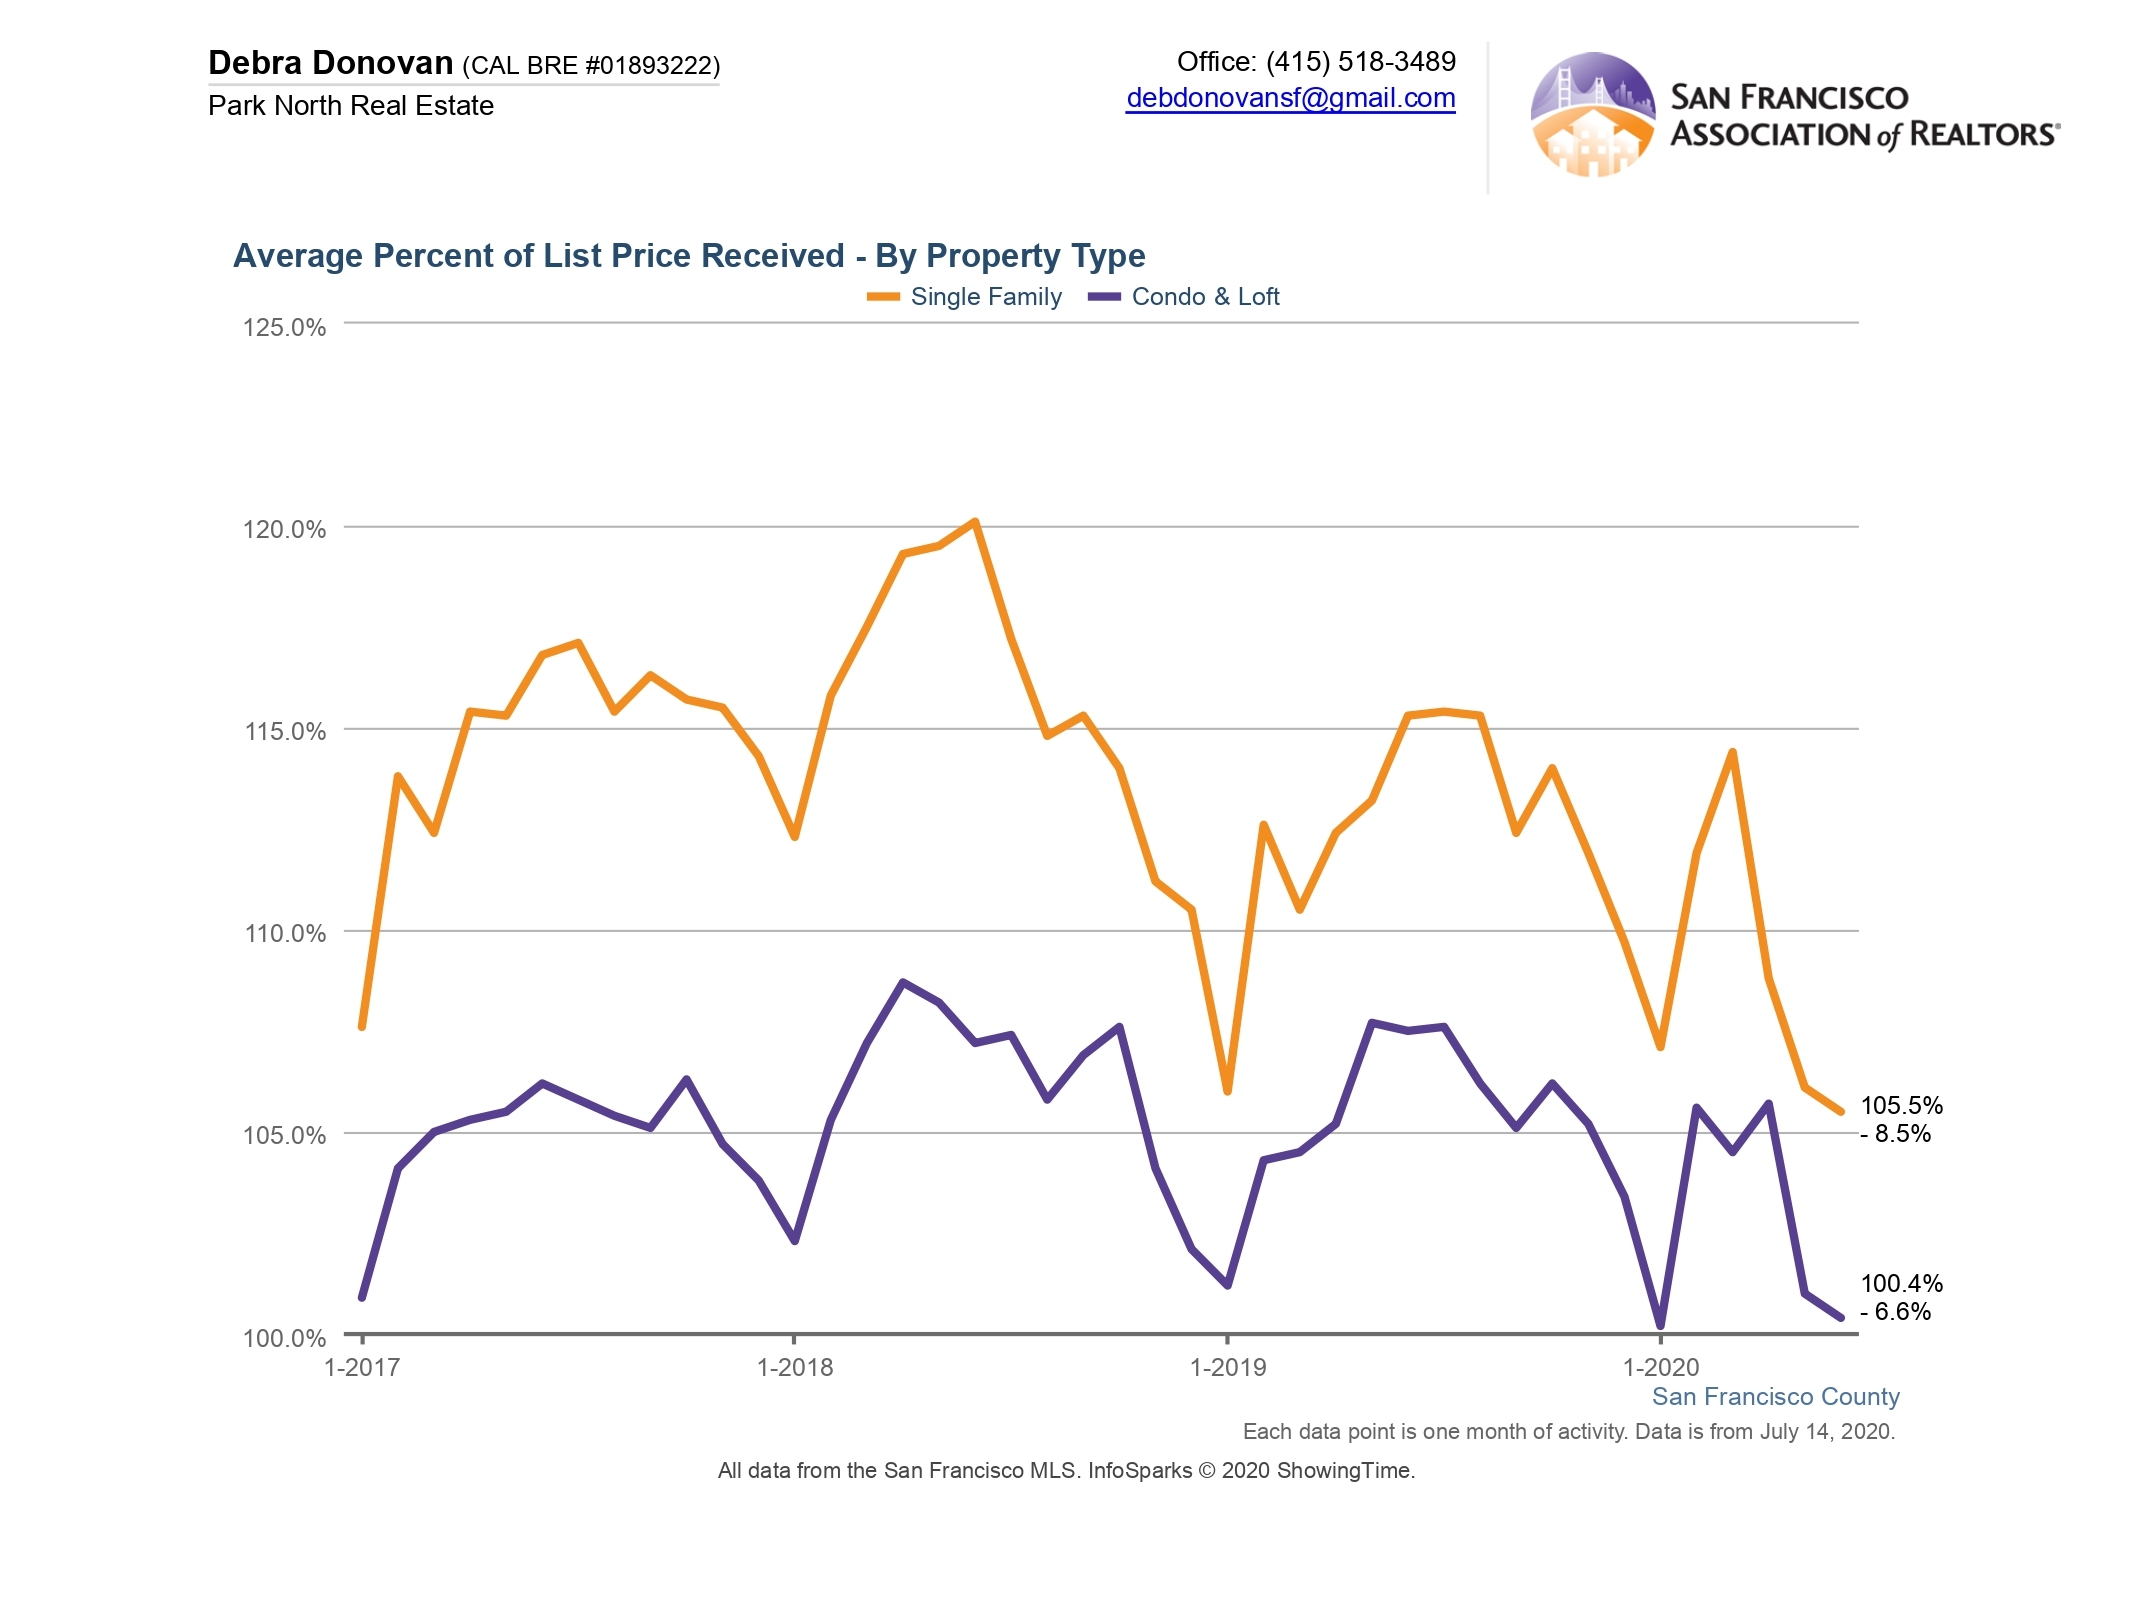
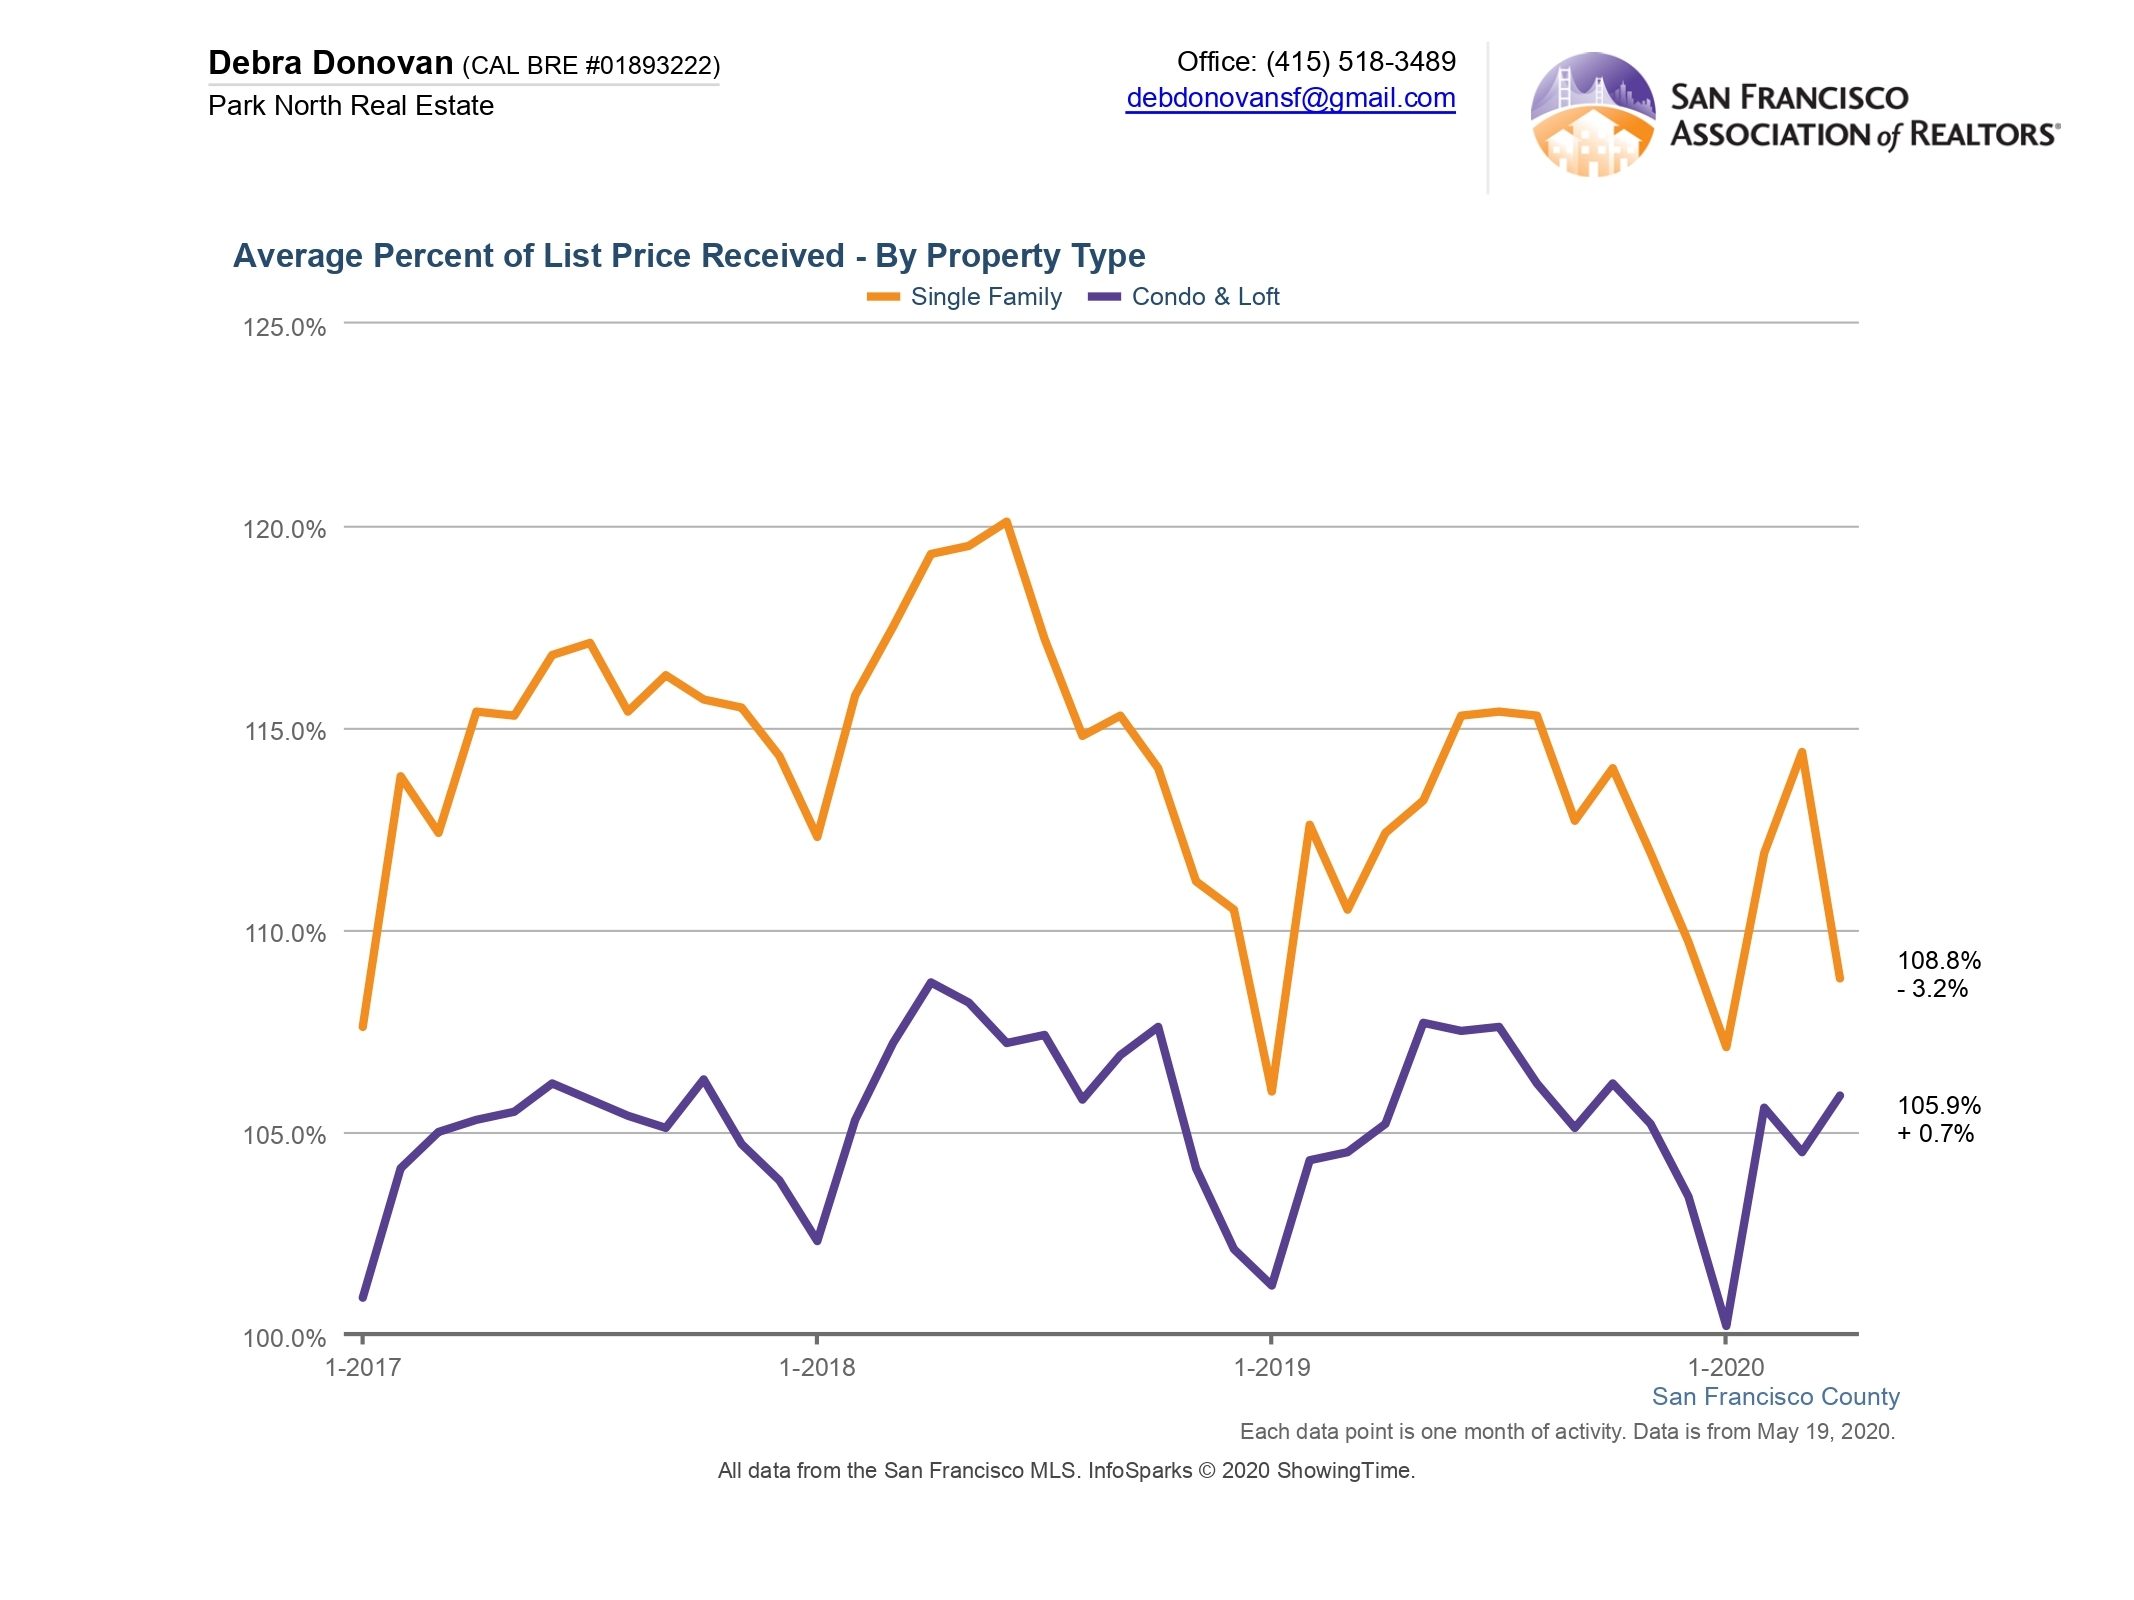
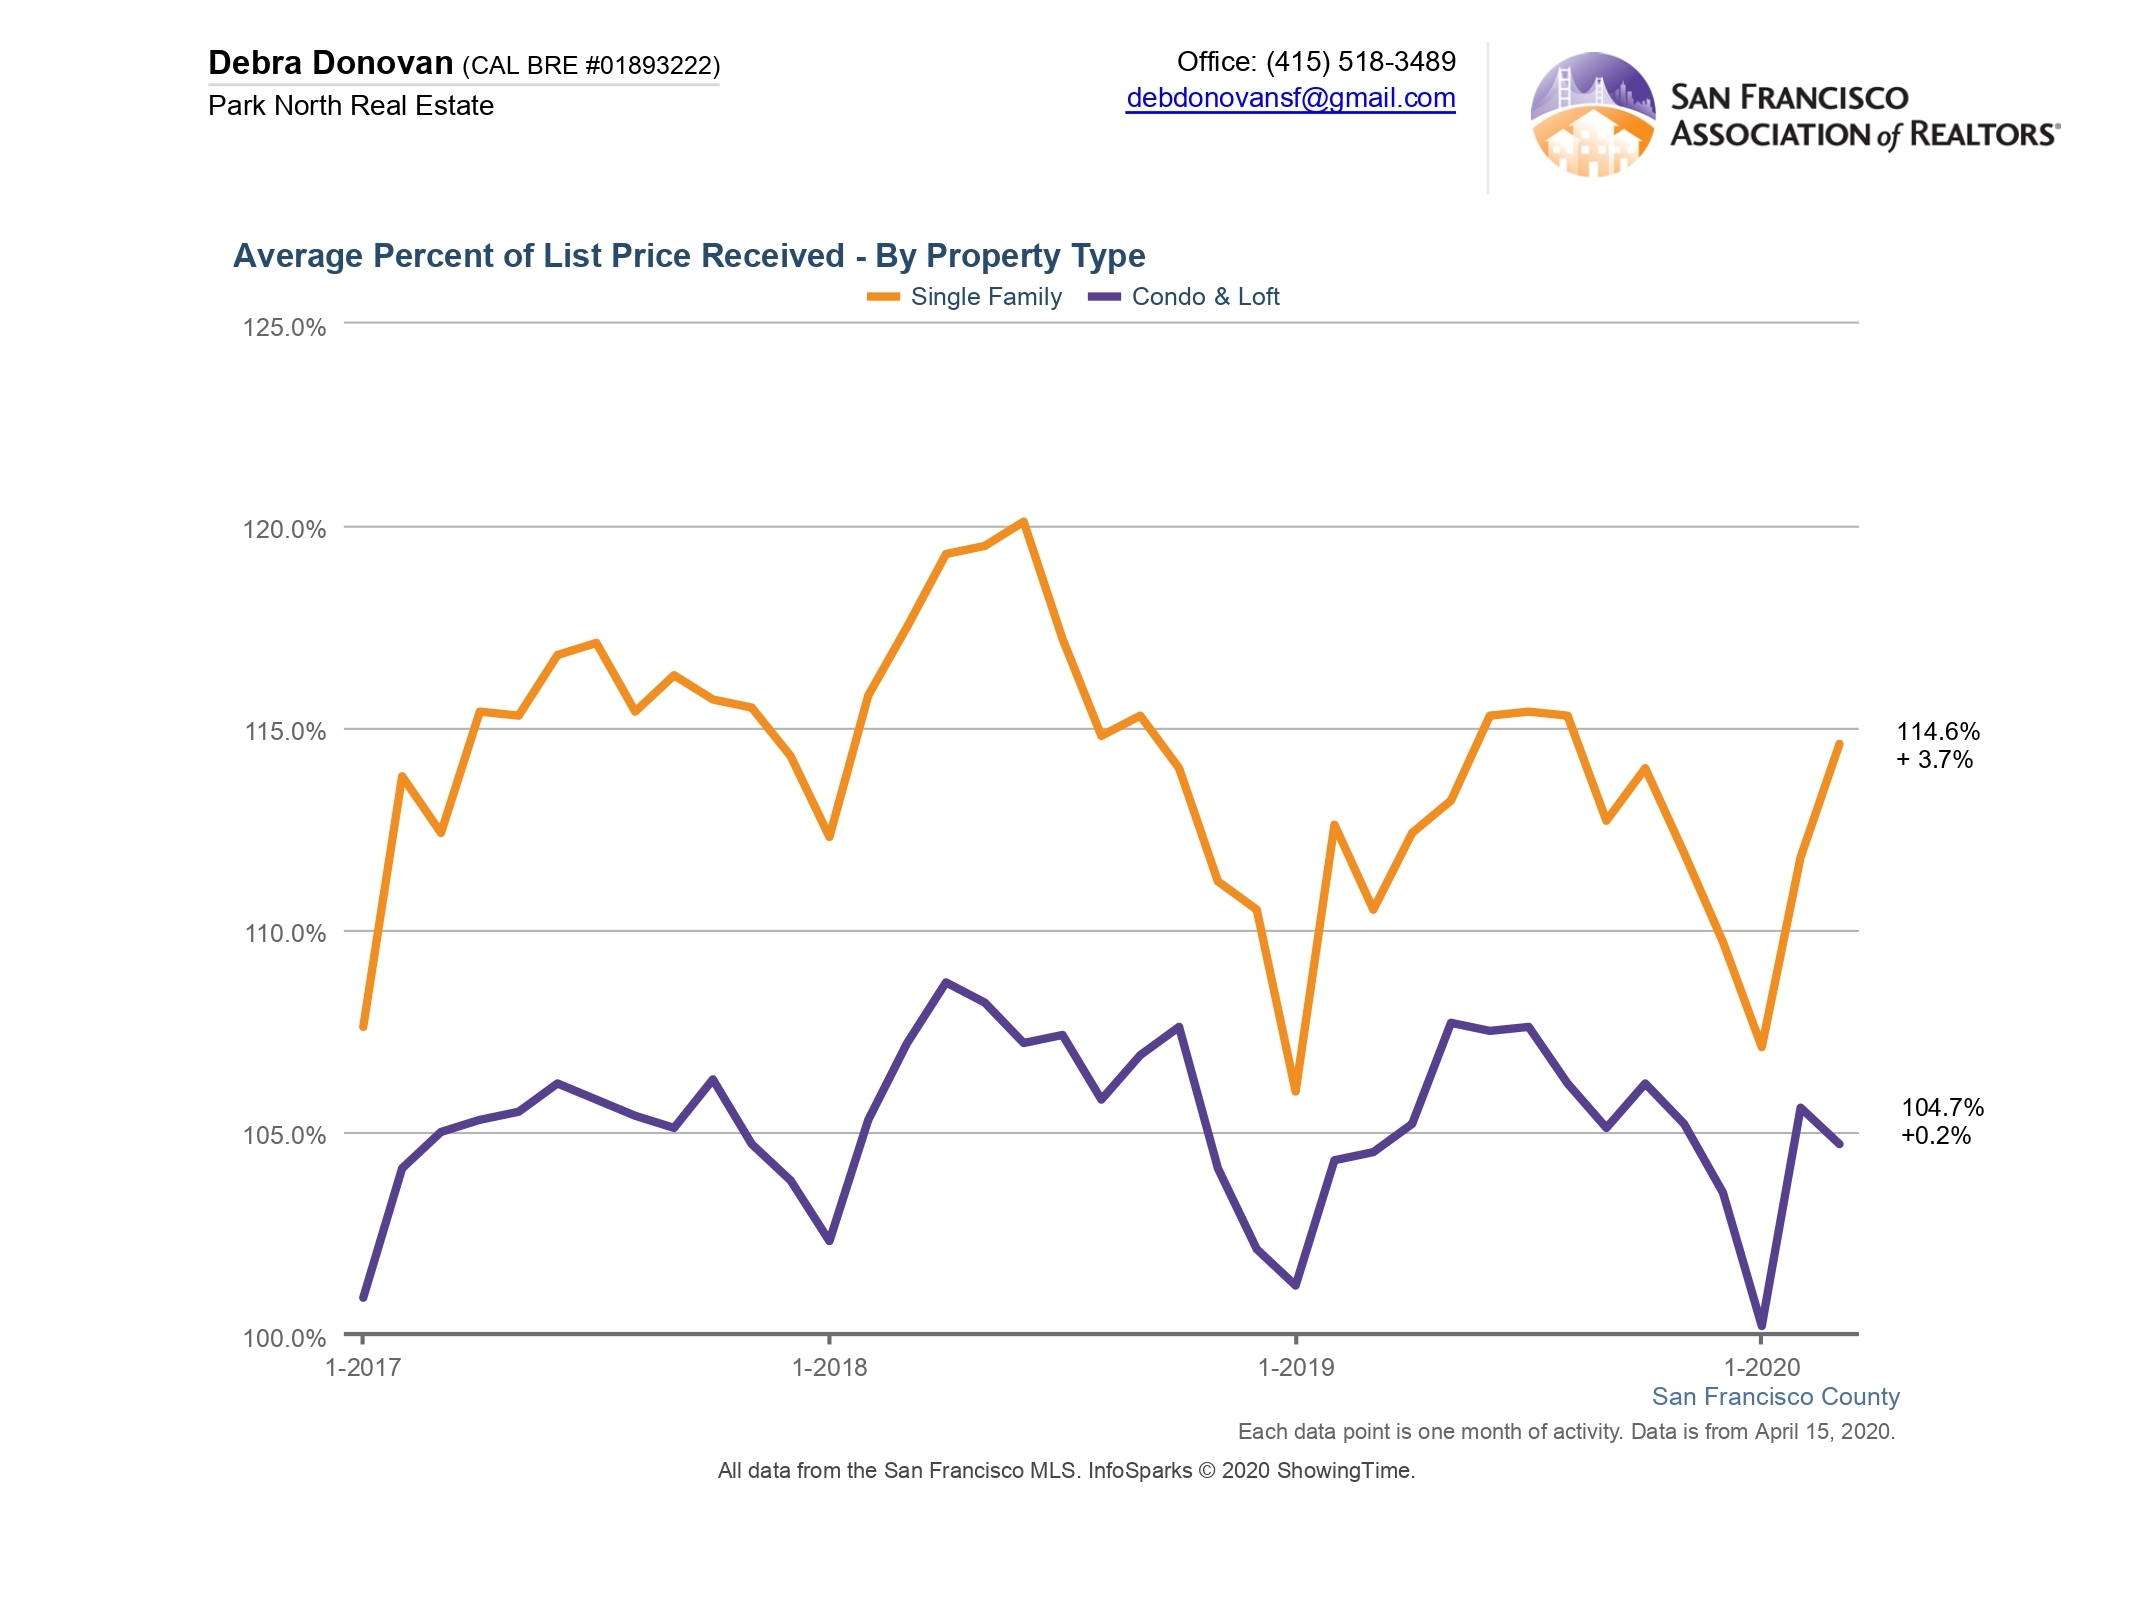
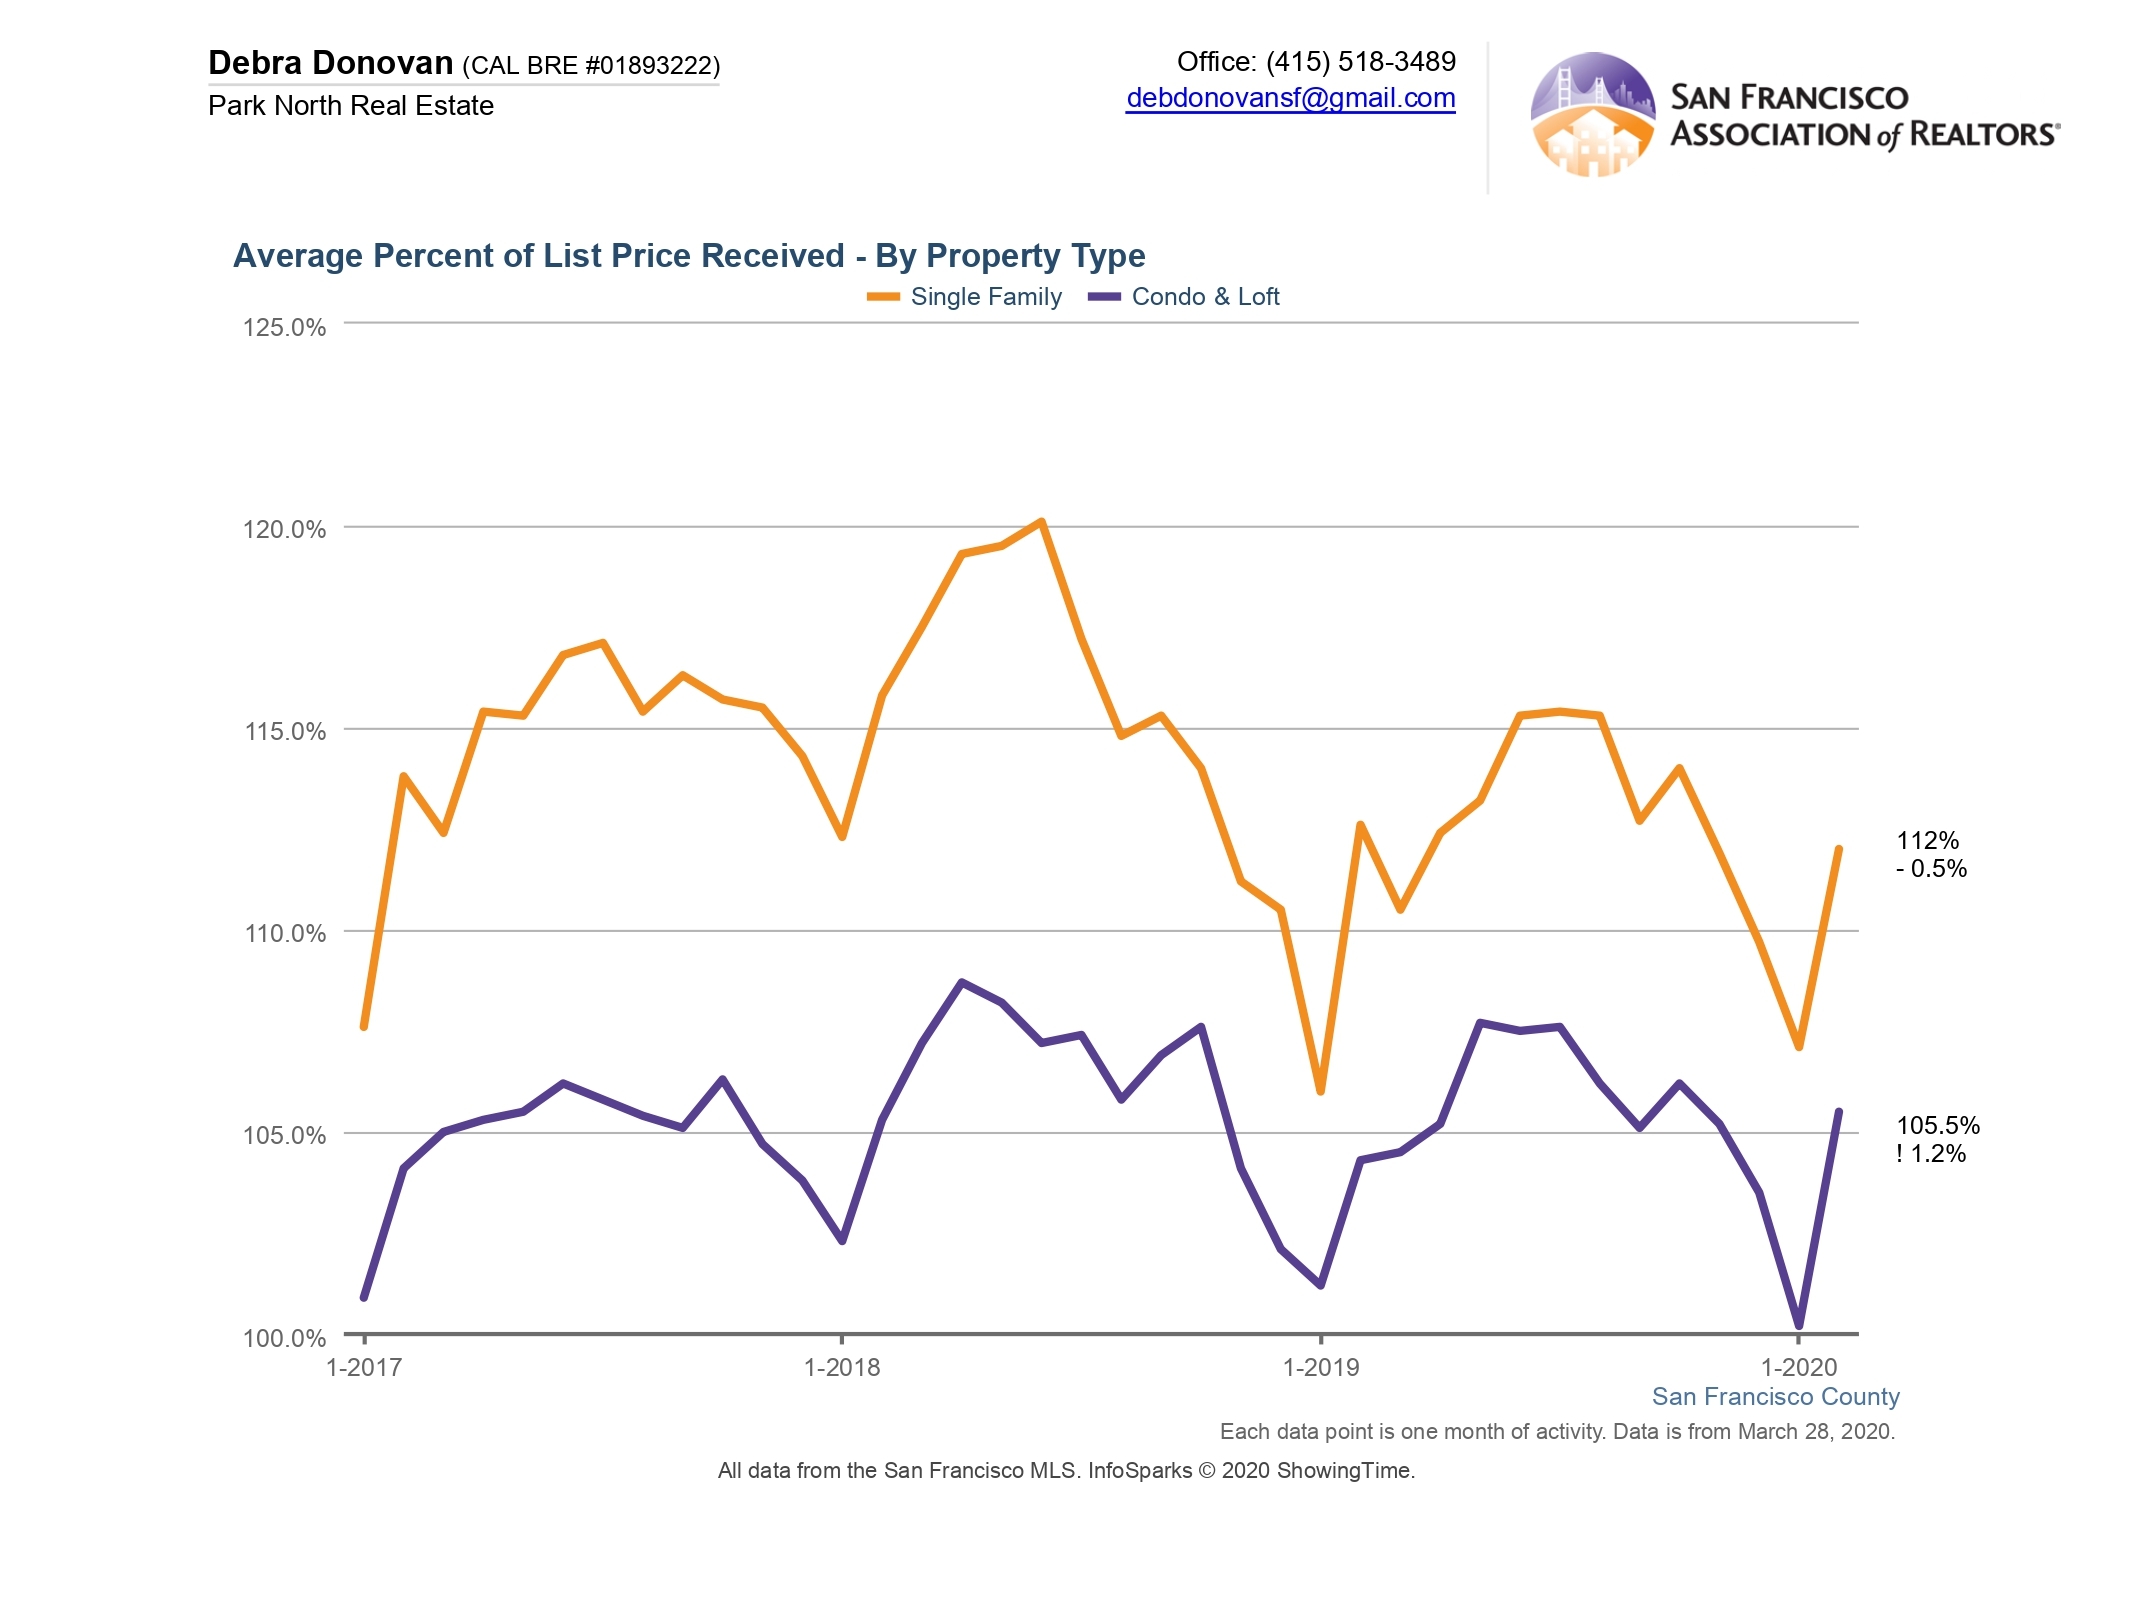
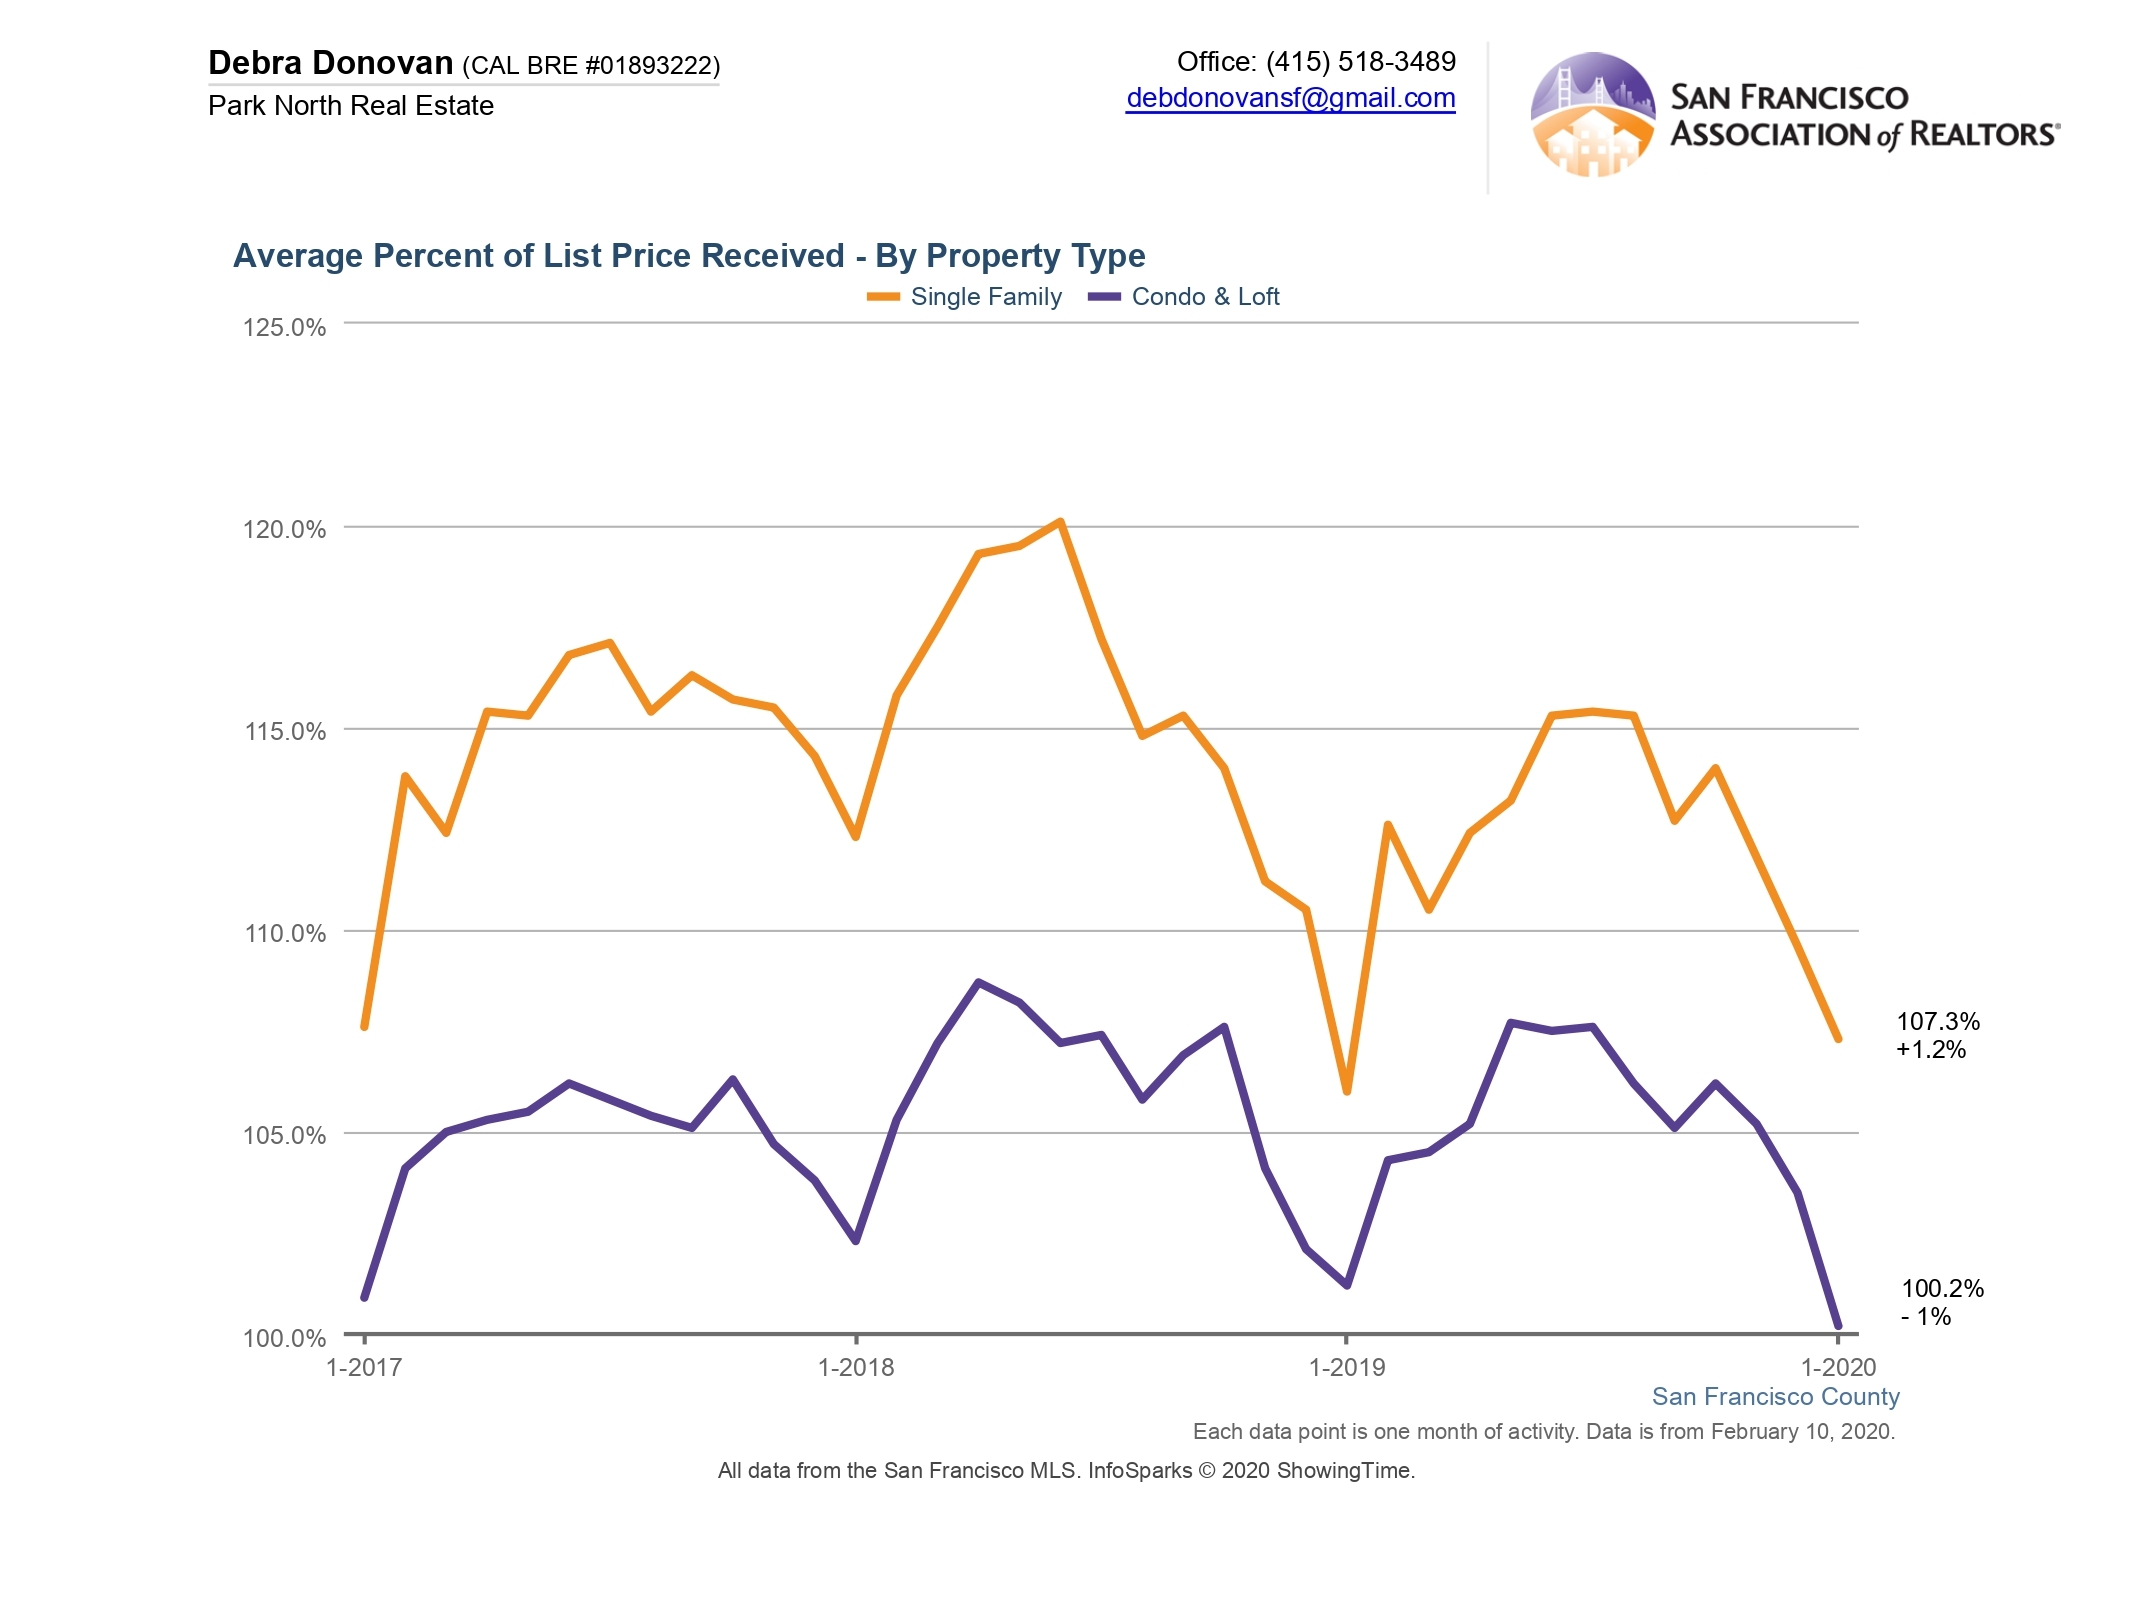
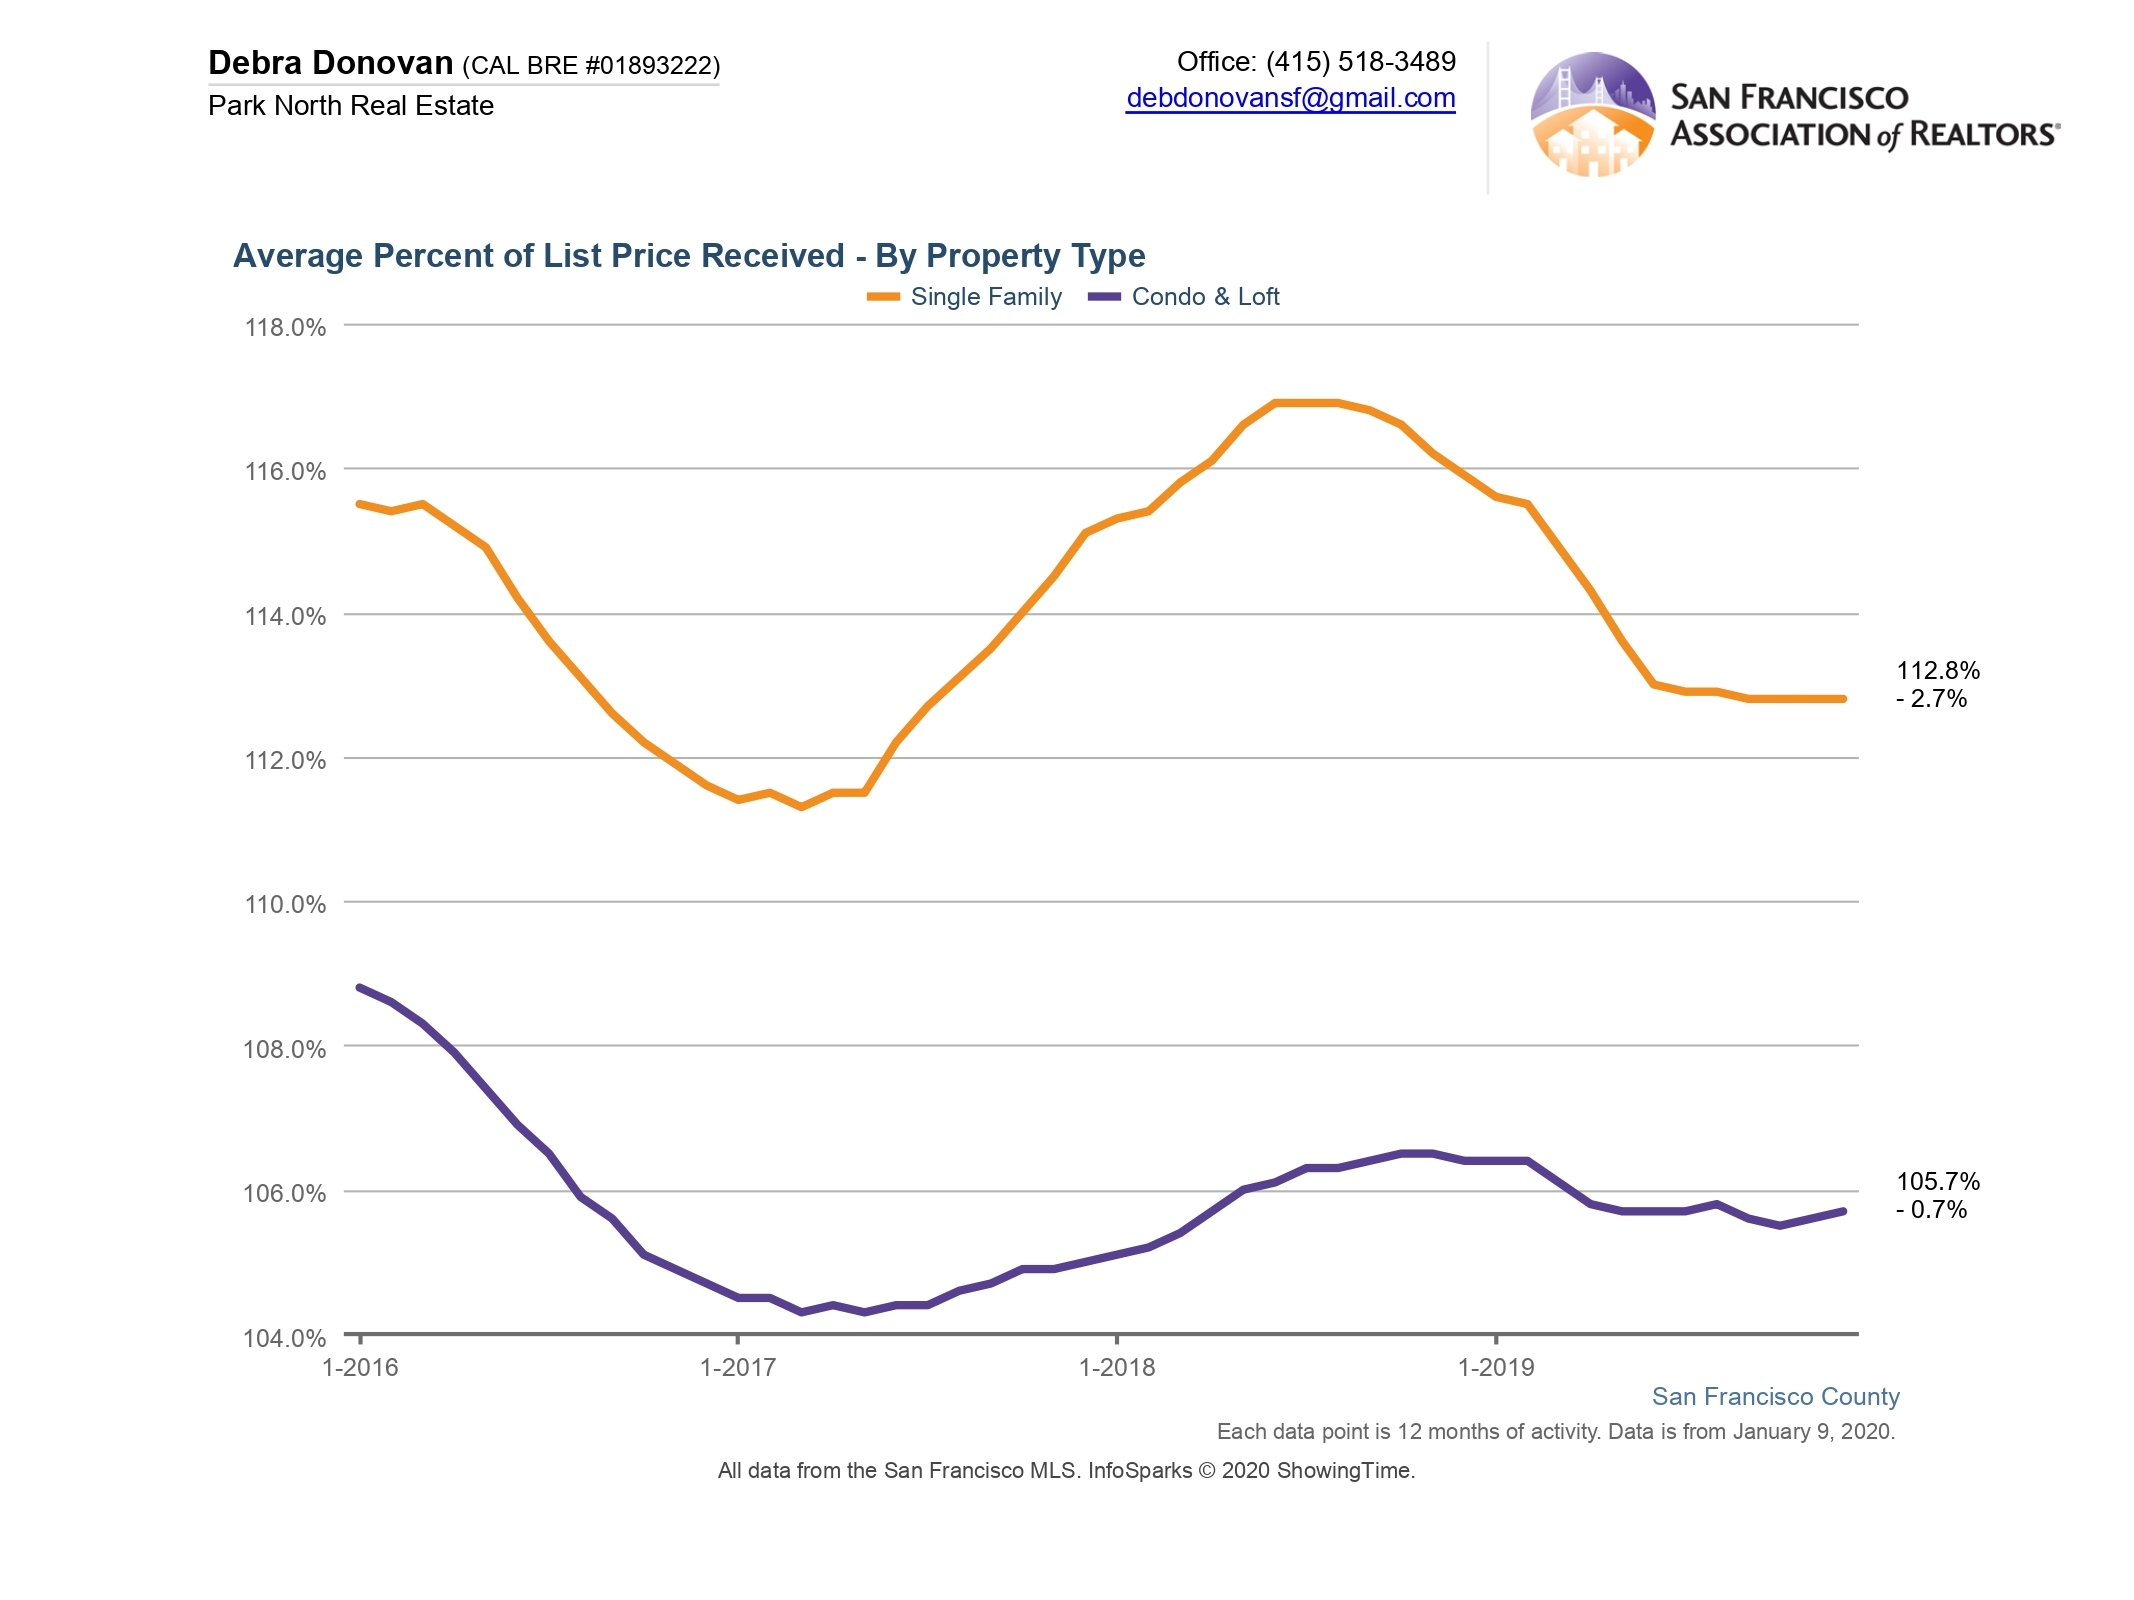
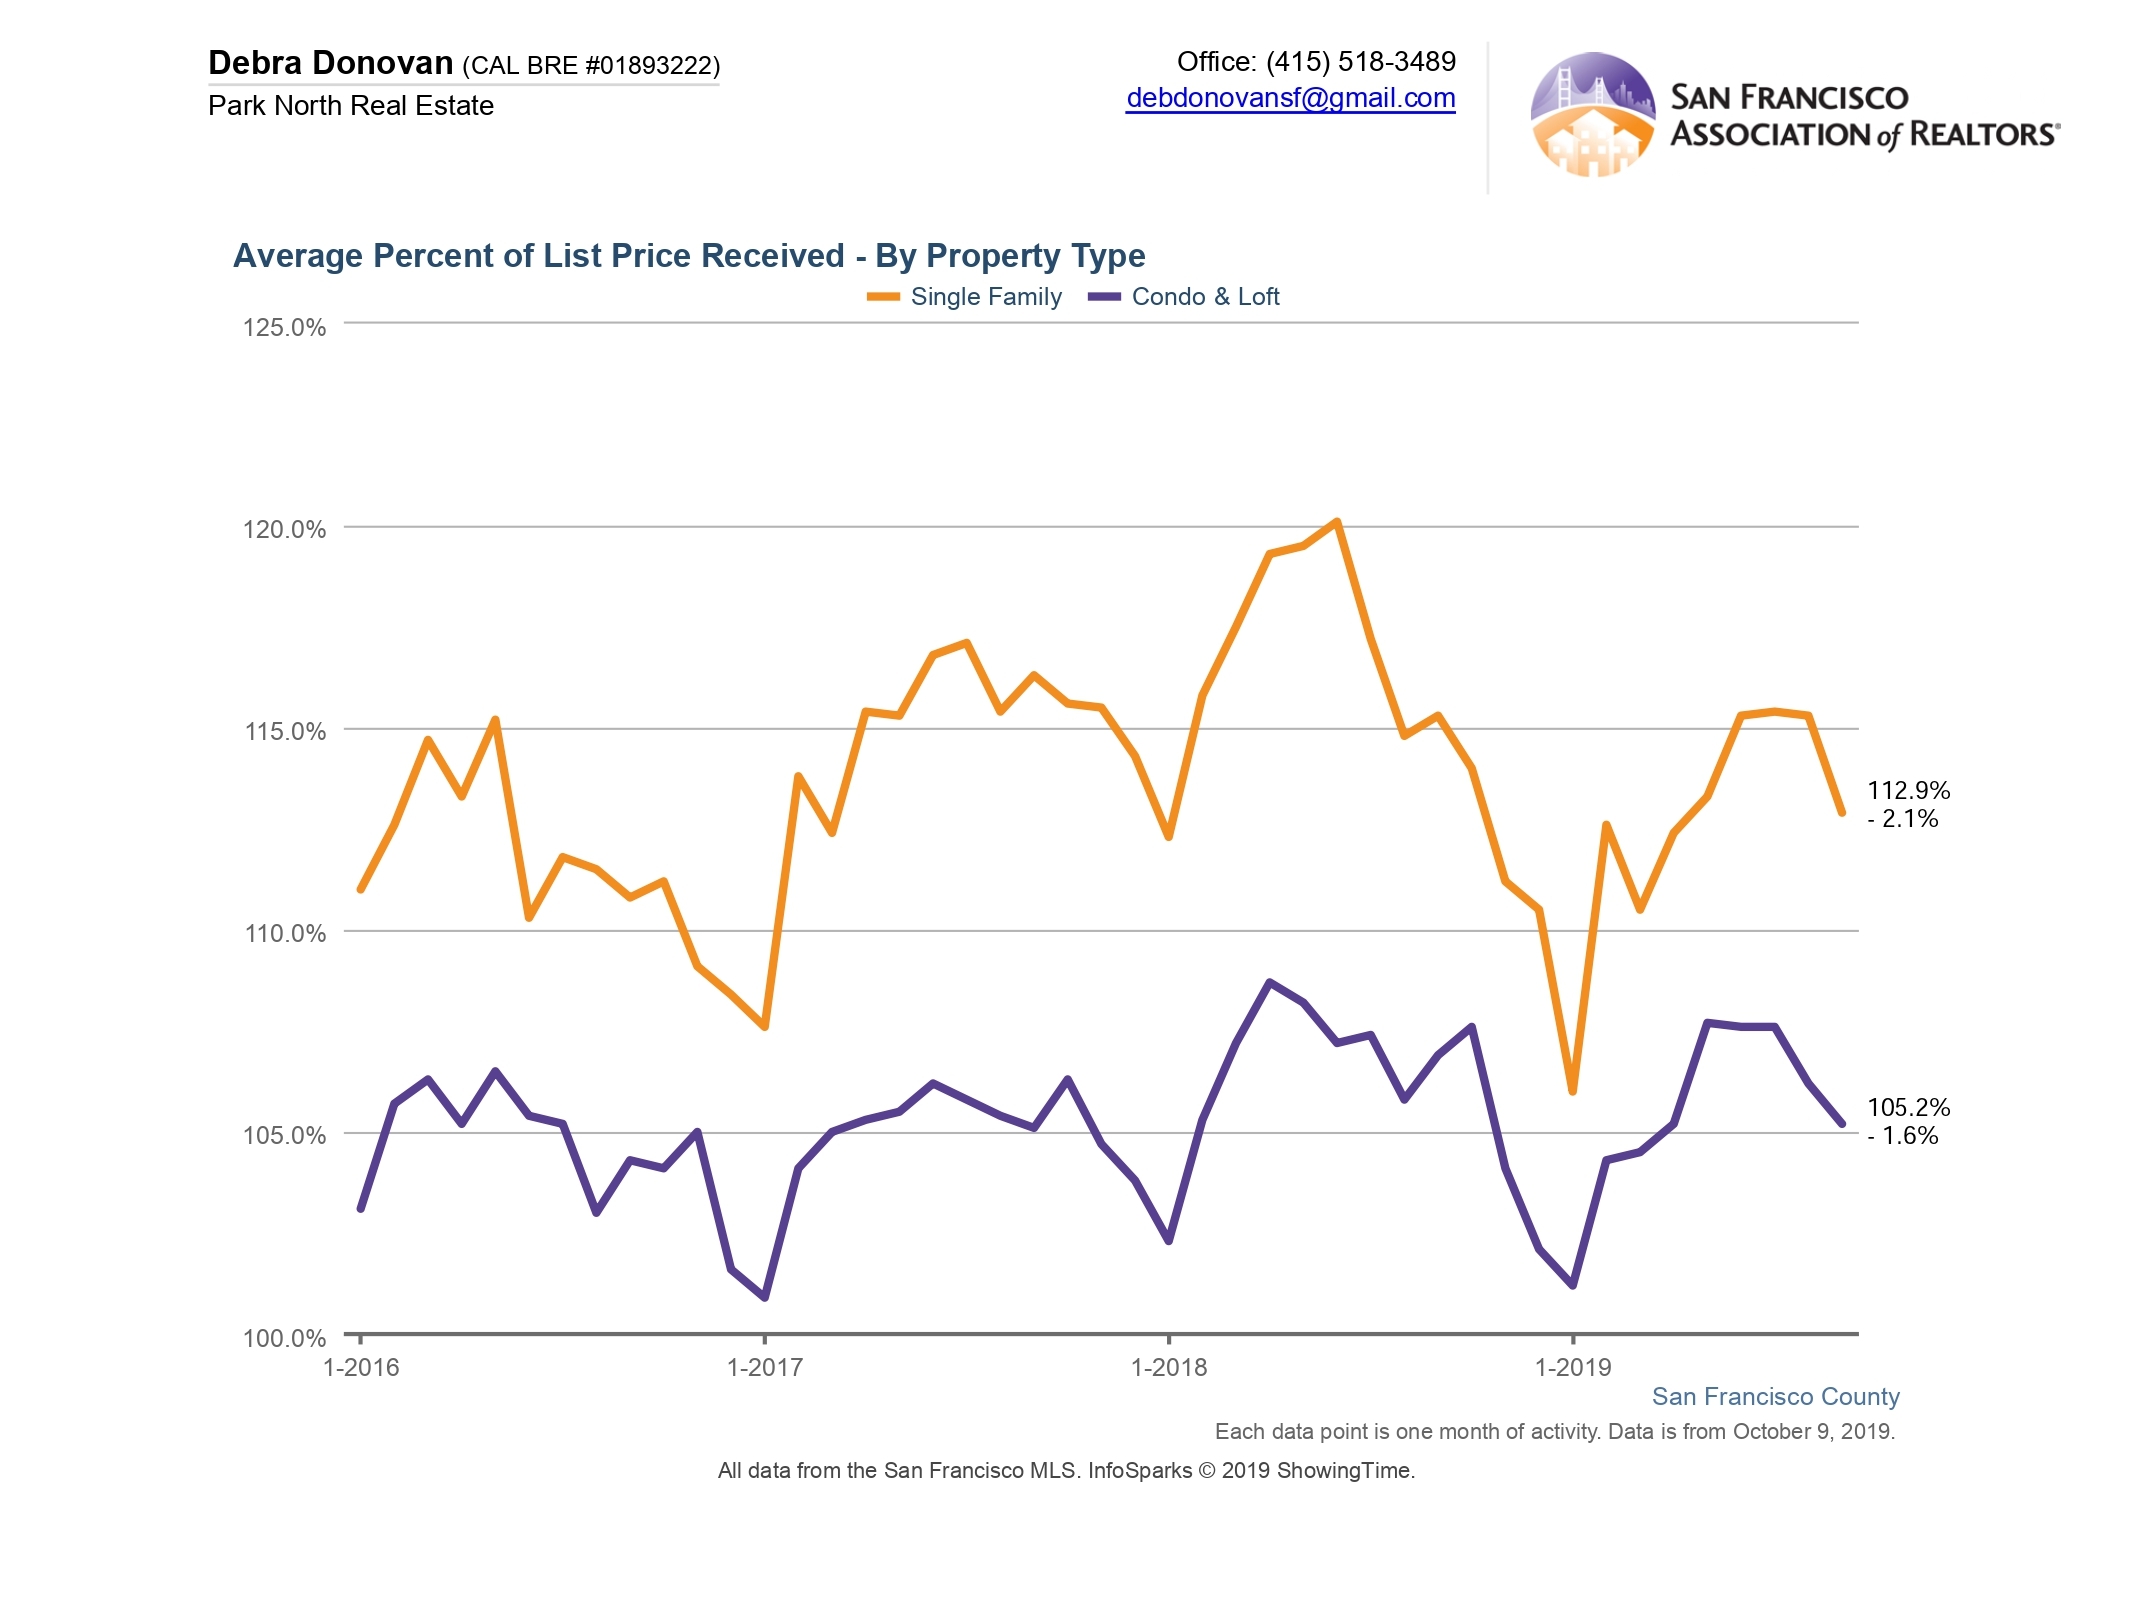
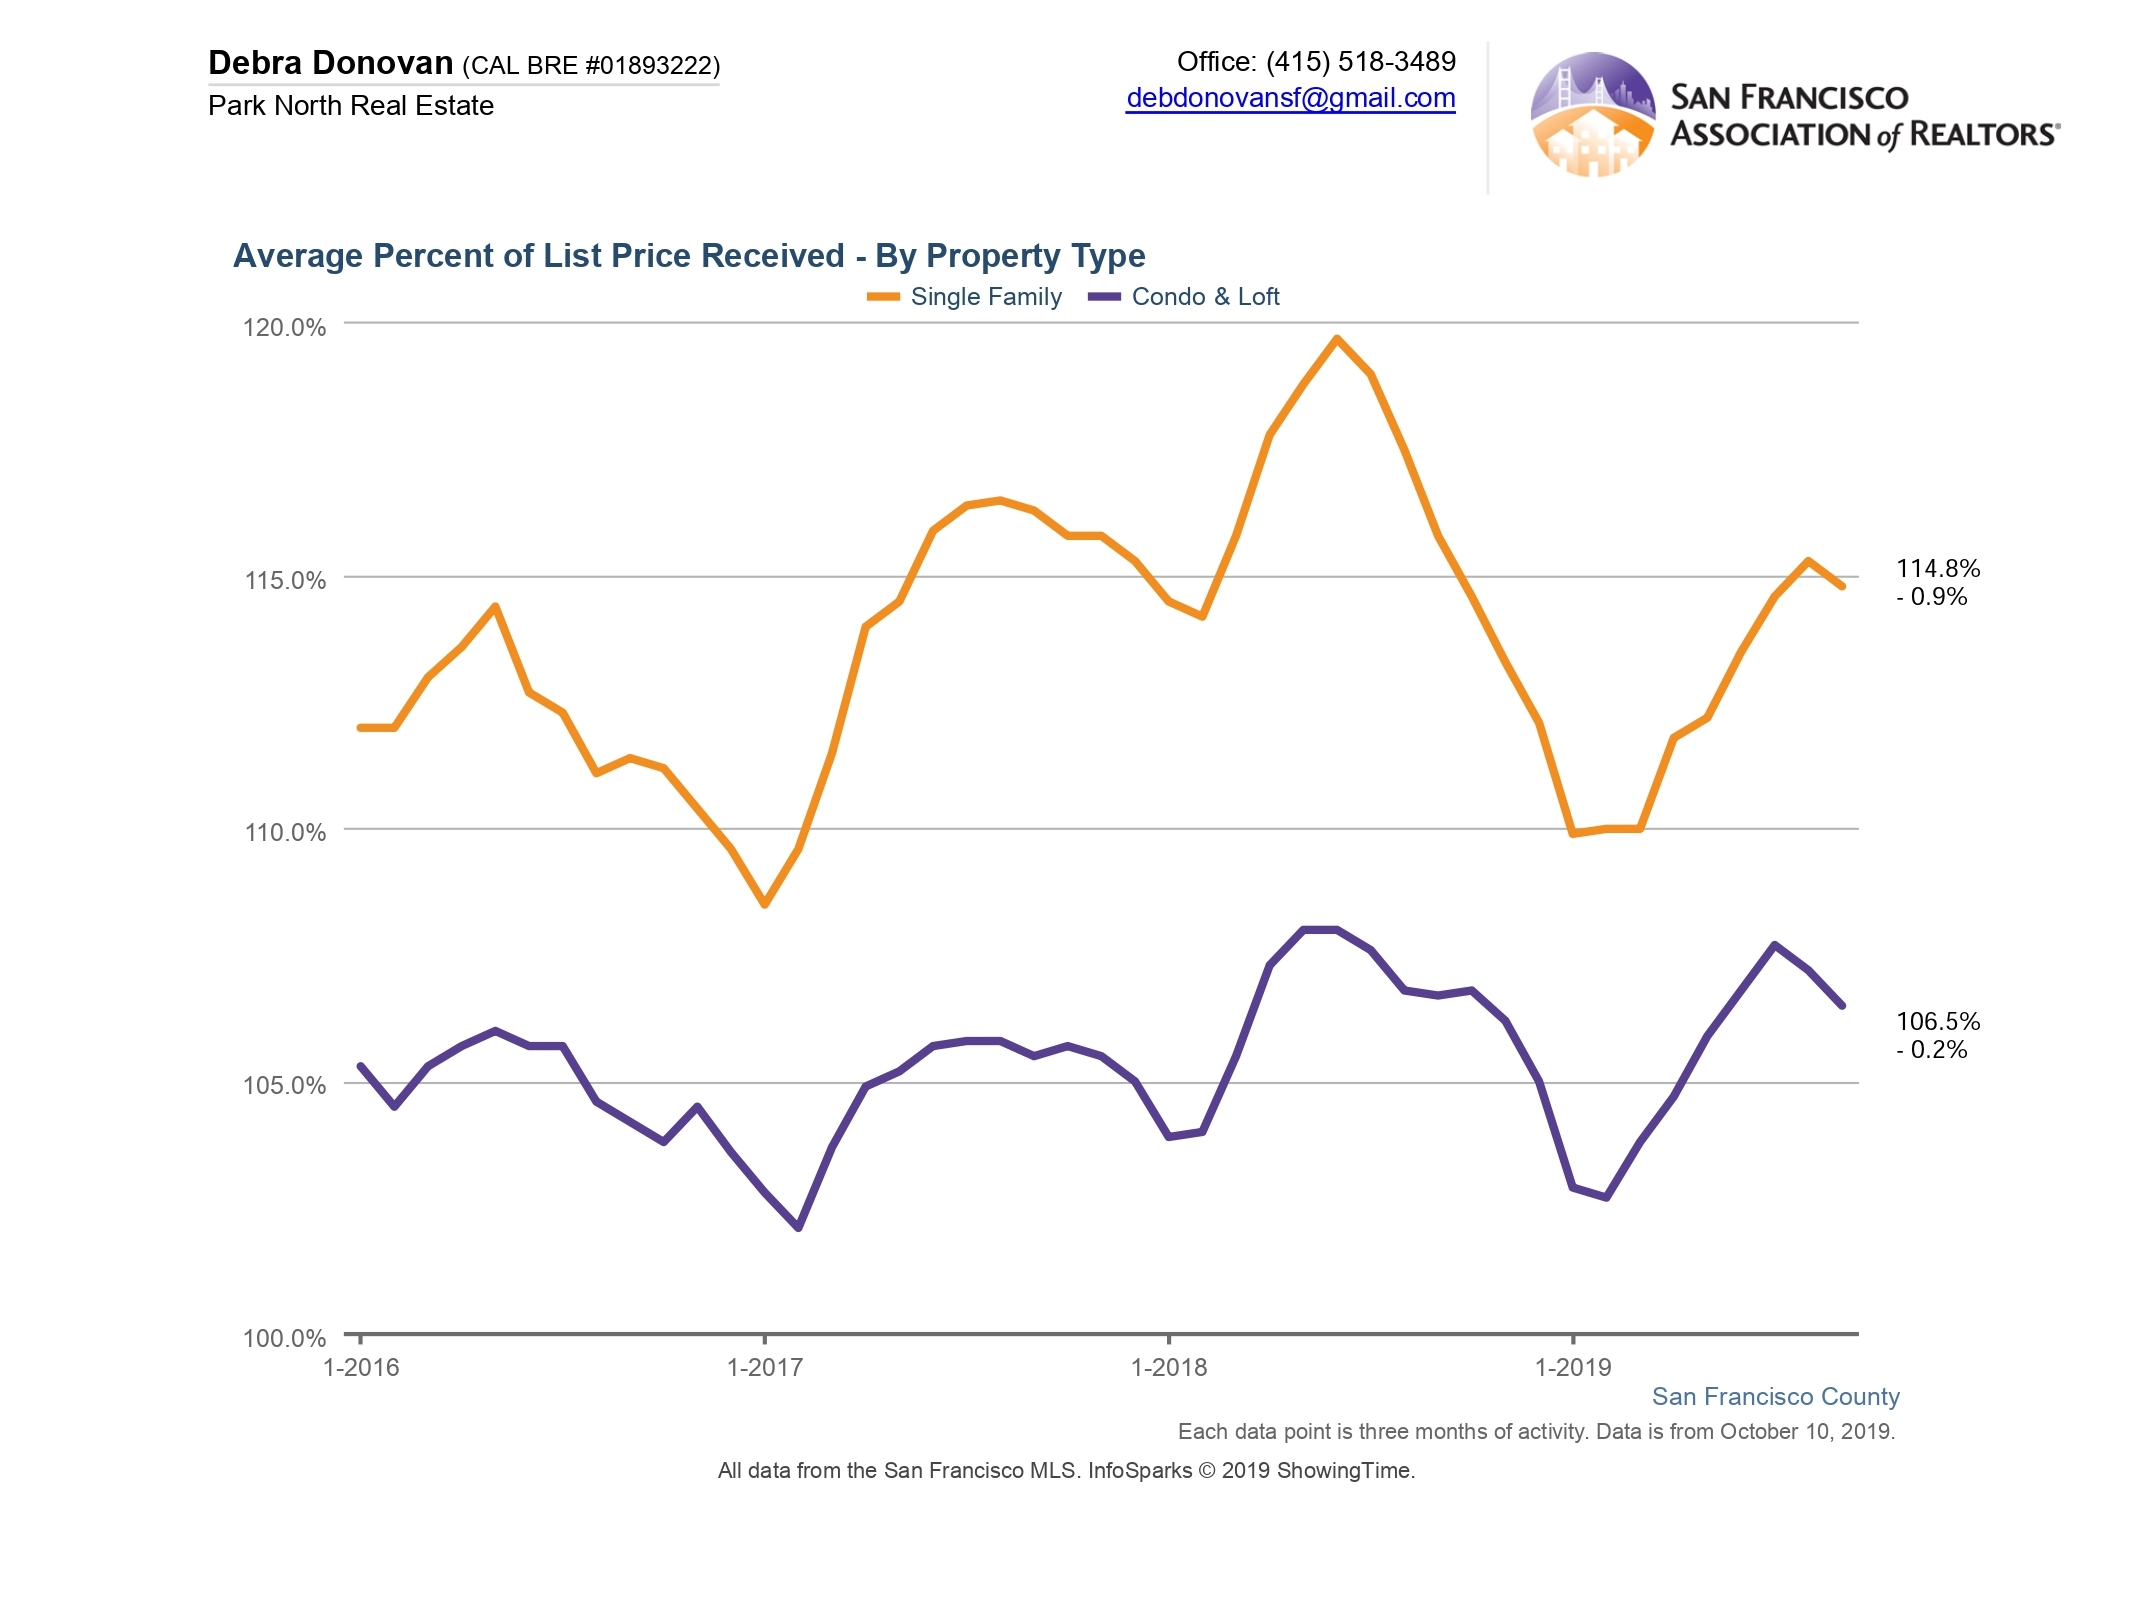
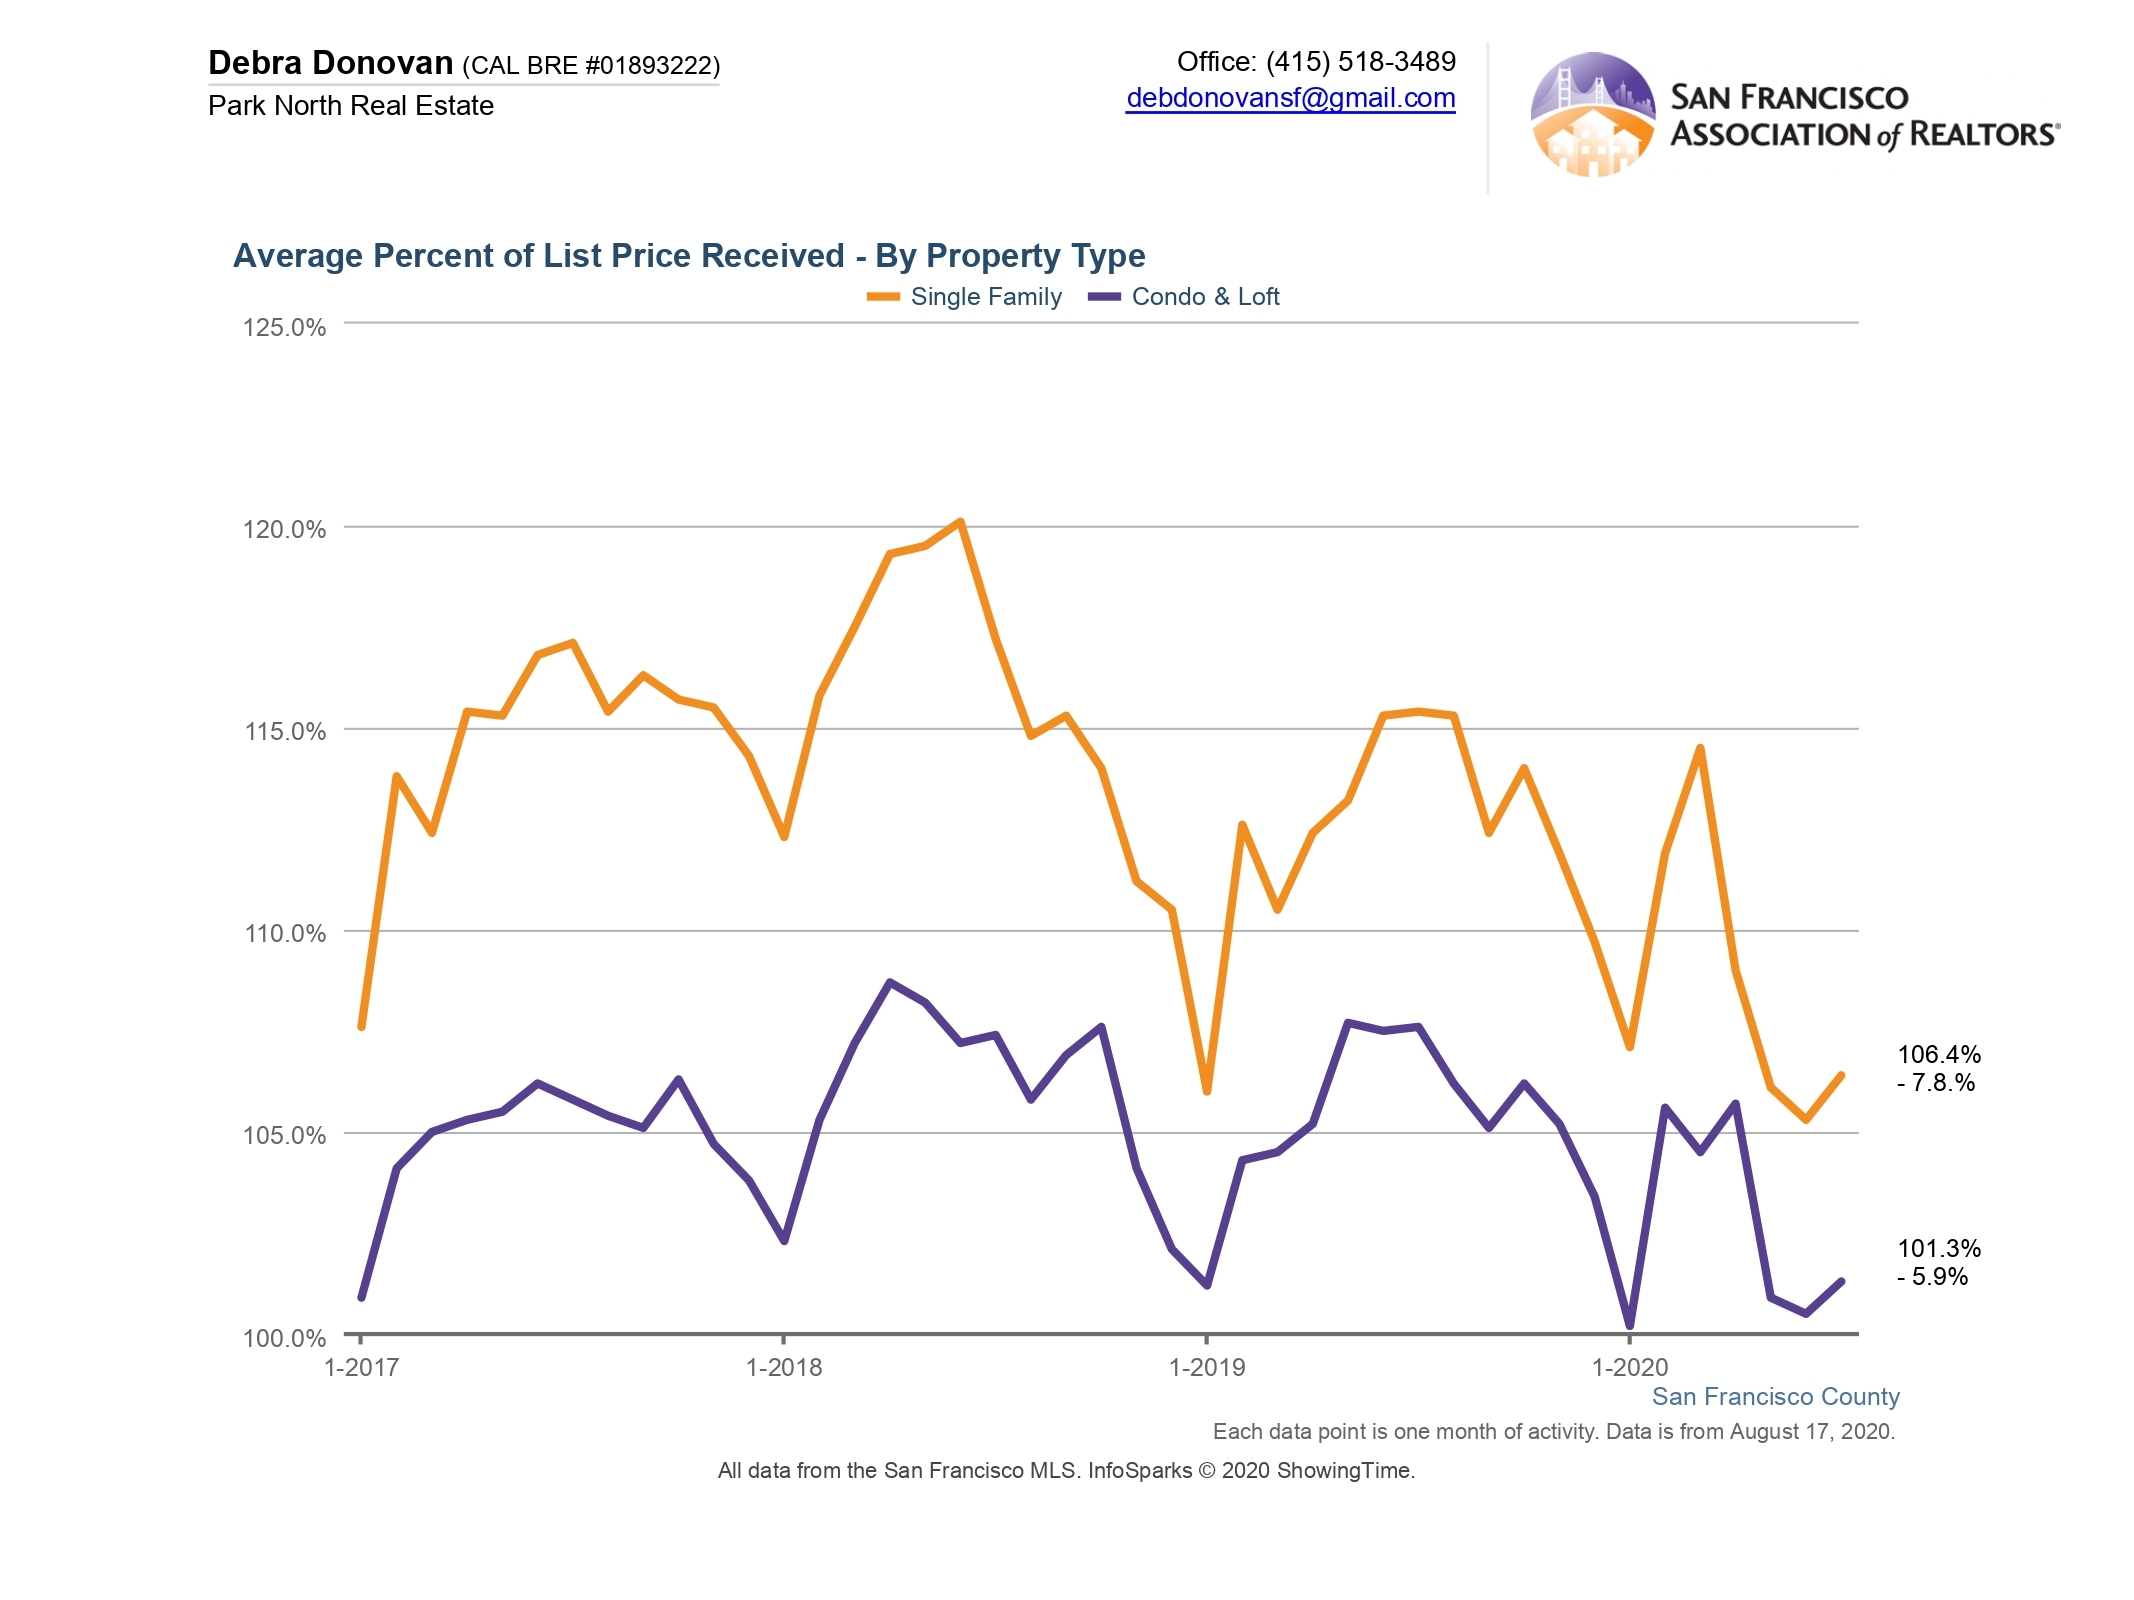
Average Percentage of List Price Received:
On average single family homes sold for 6% over their list price in July, down almost 8% compared to the same month last year. Condos and lofts sold for just over 1% over their asking price, down almost 6% year-over-year. However these statistics were on par with June of this year.
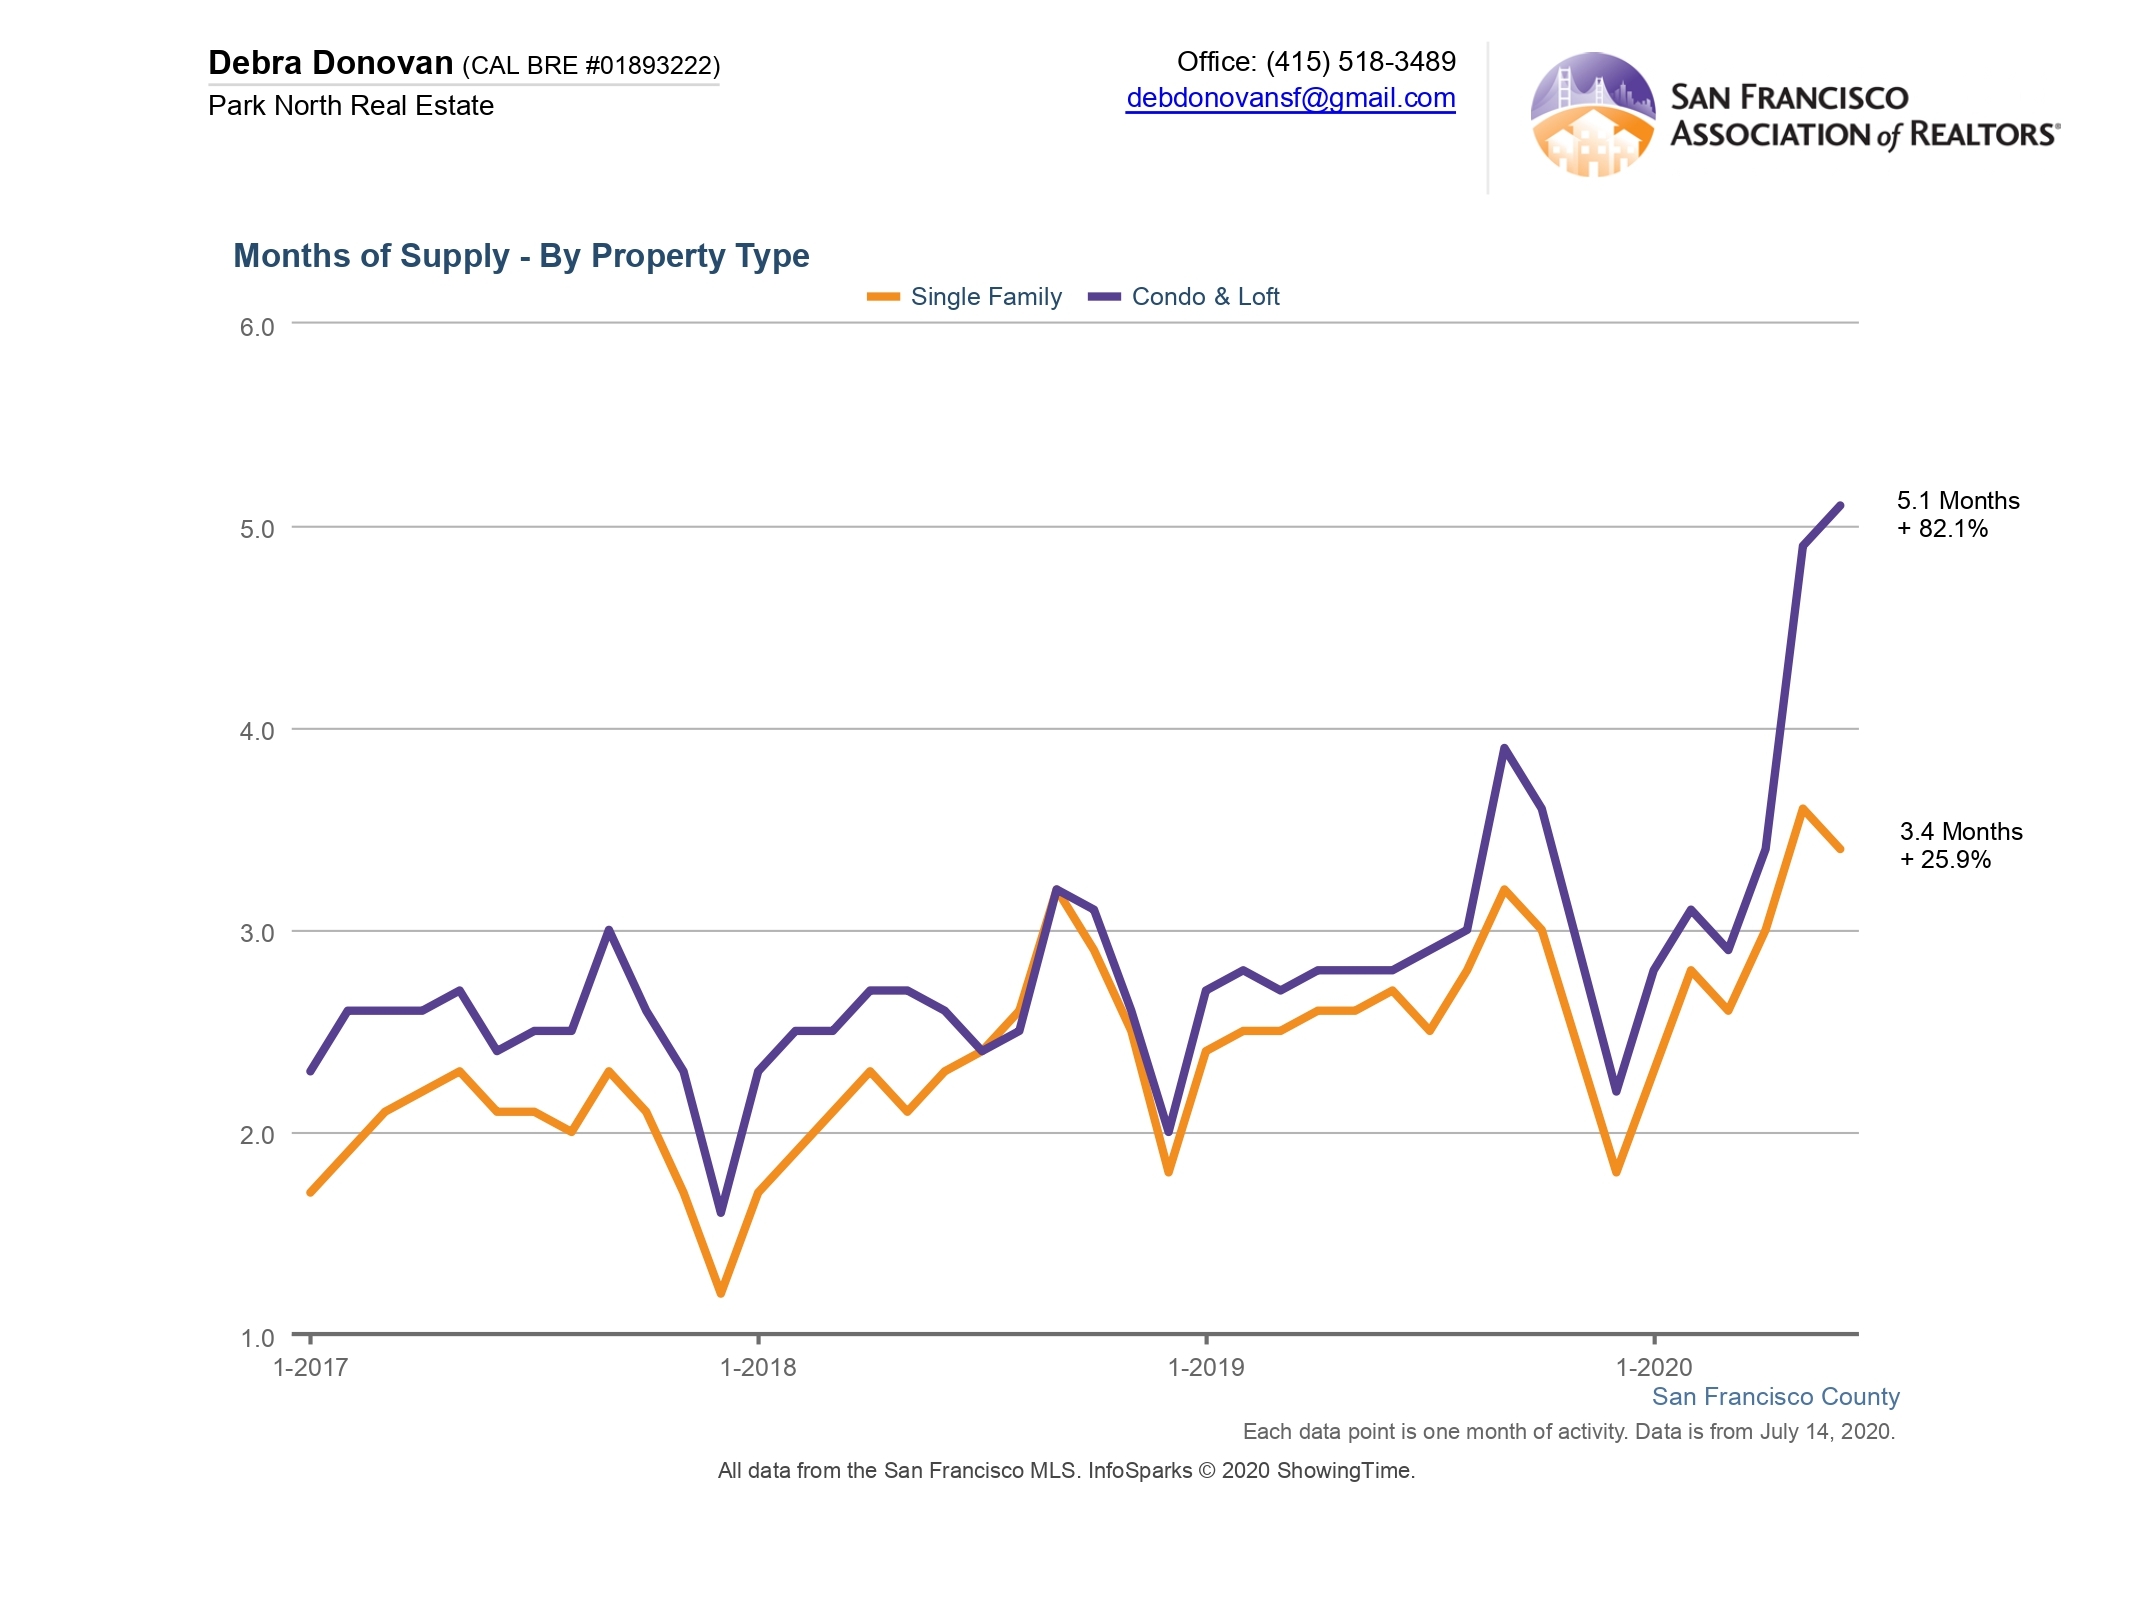
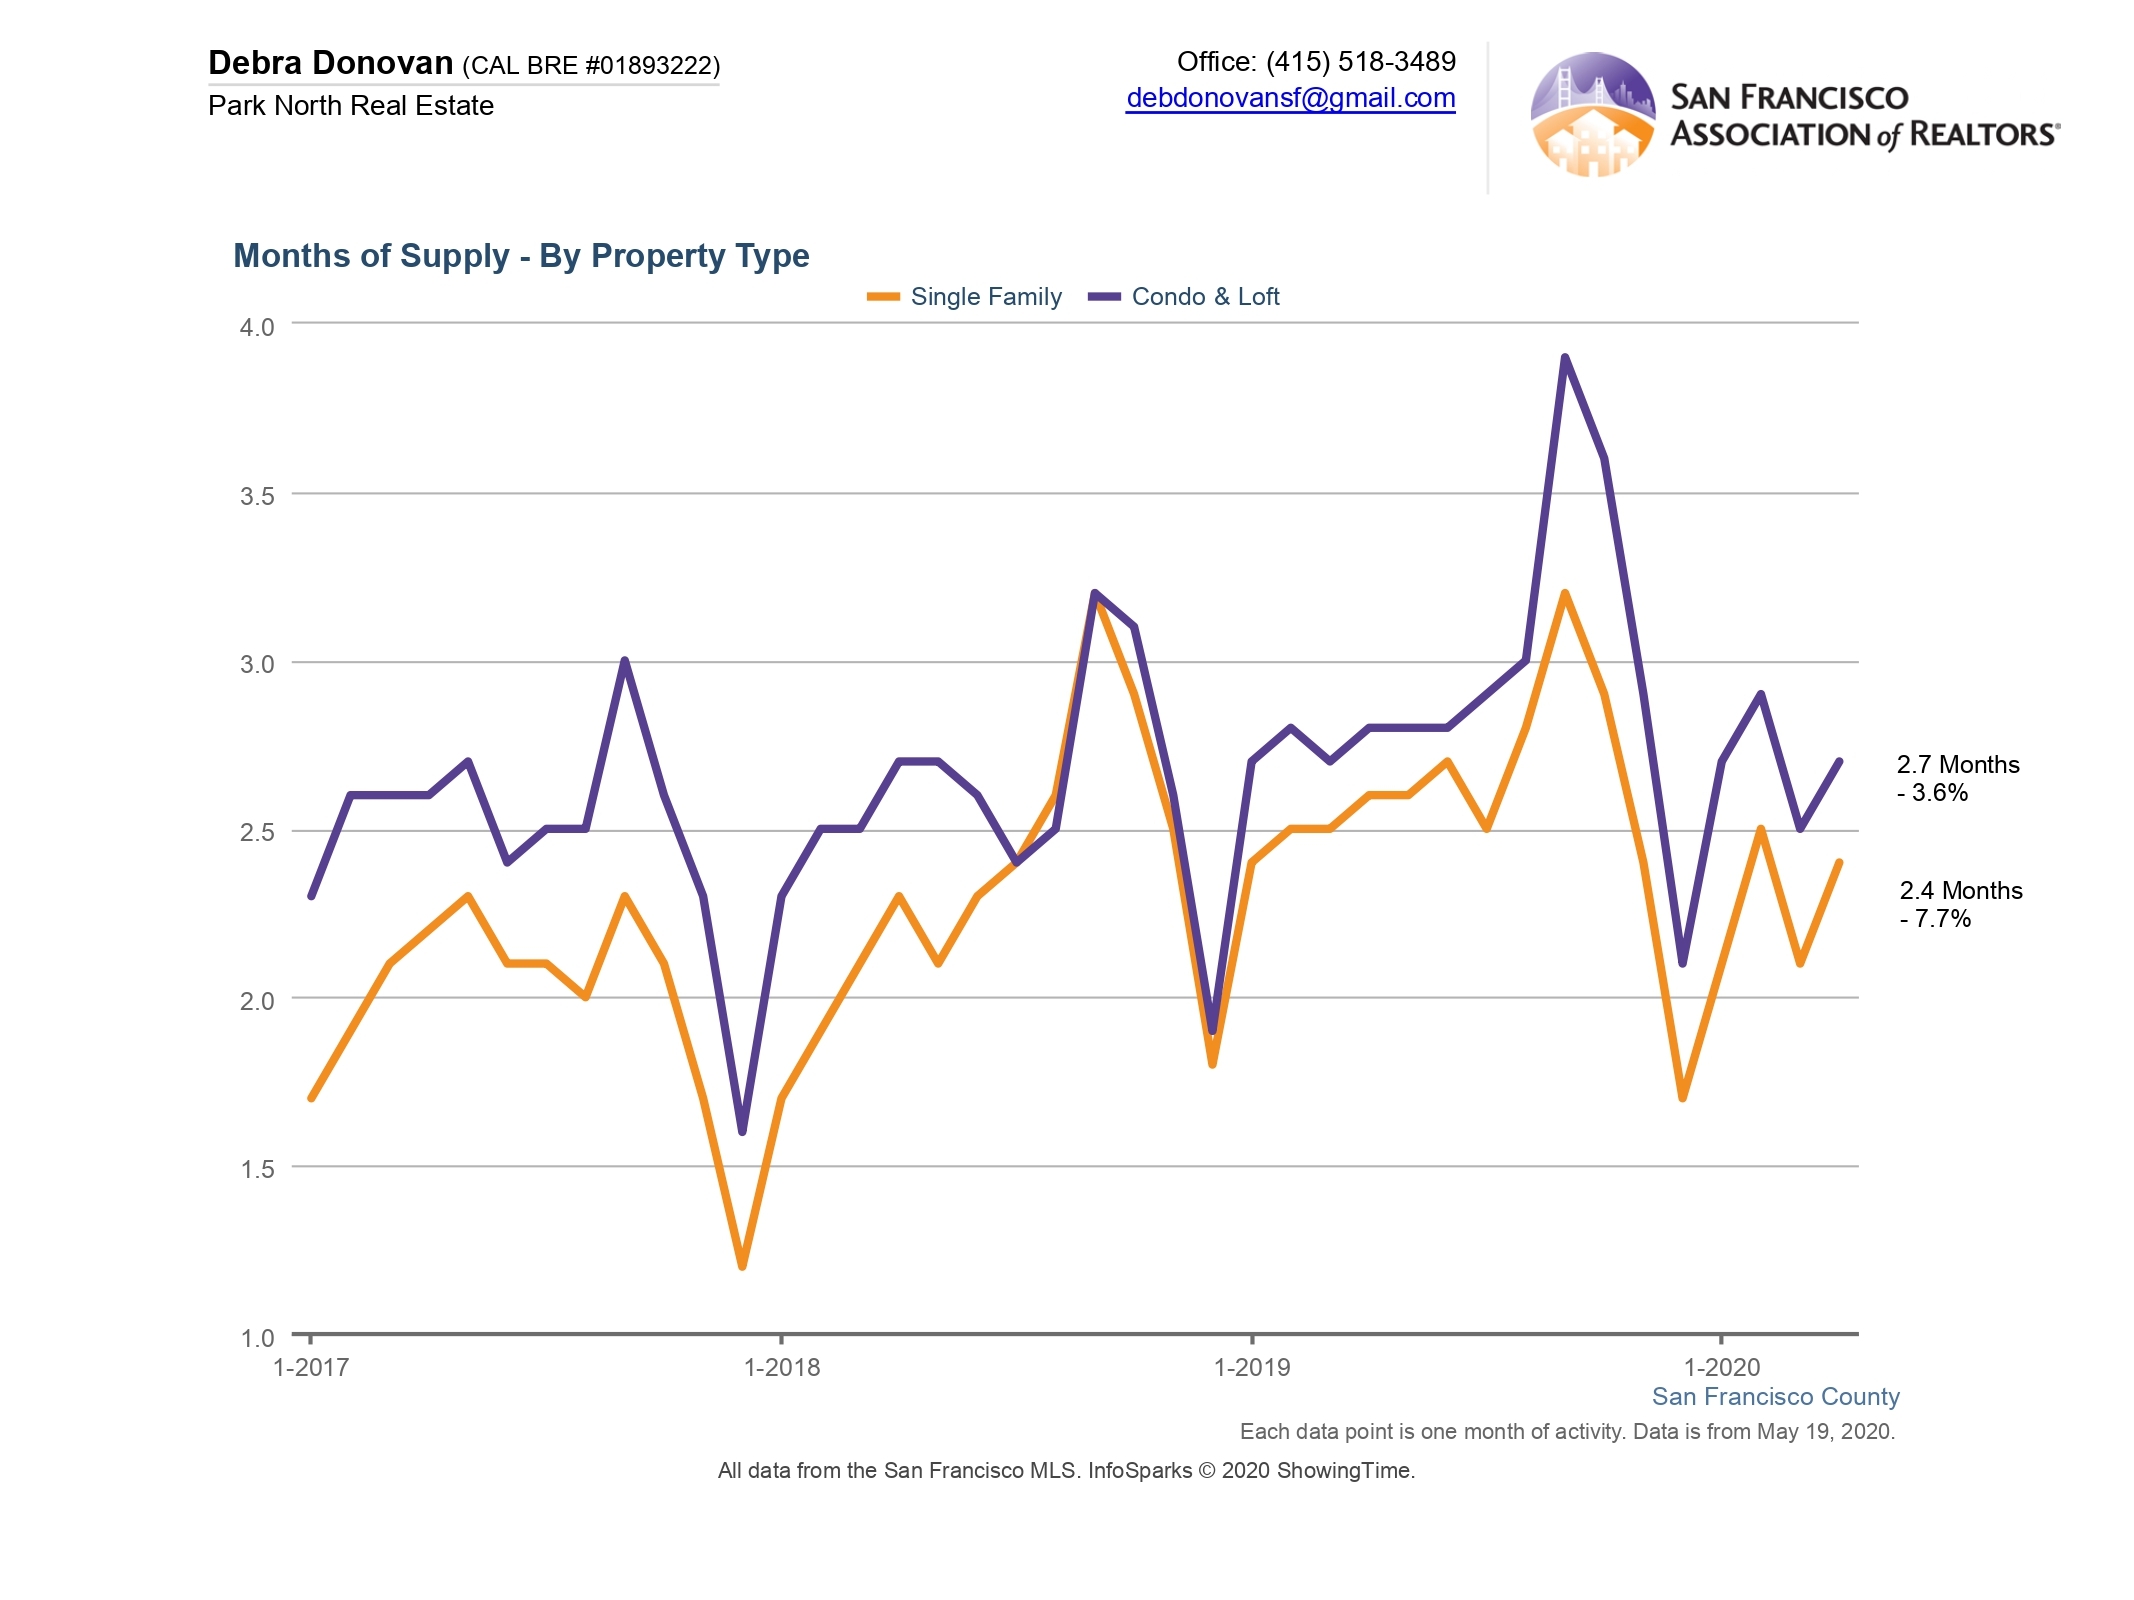
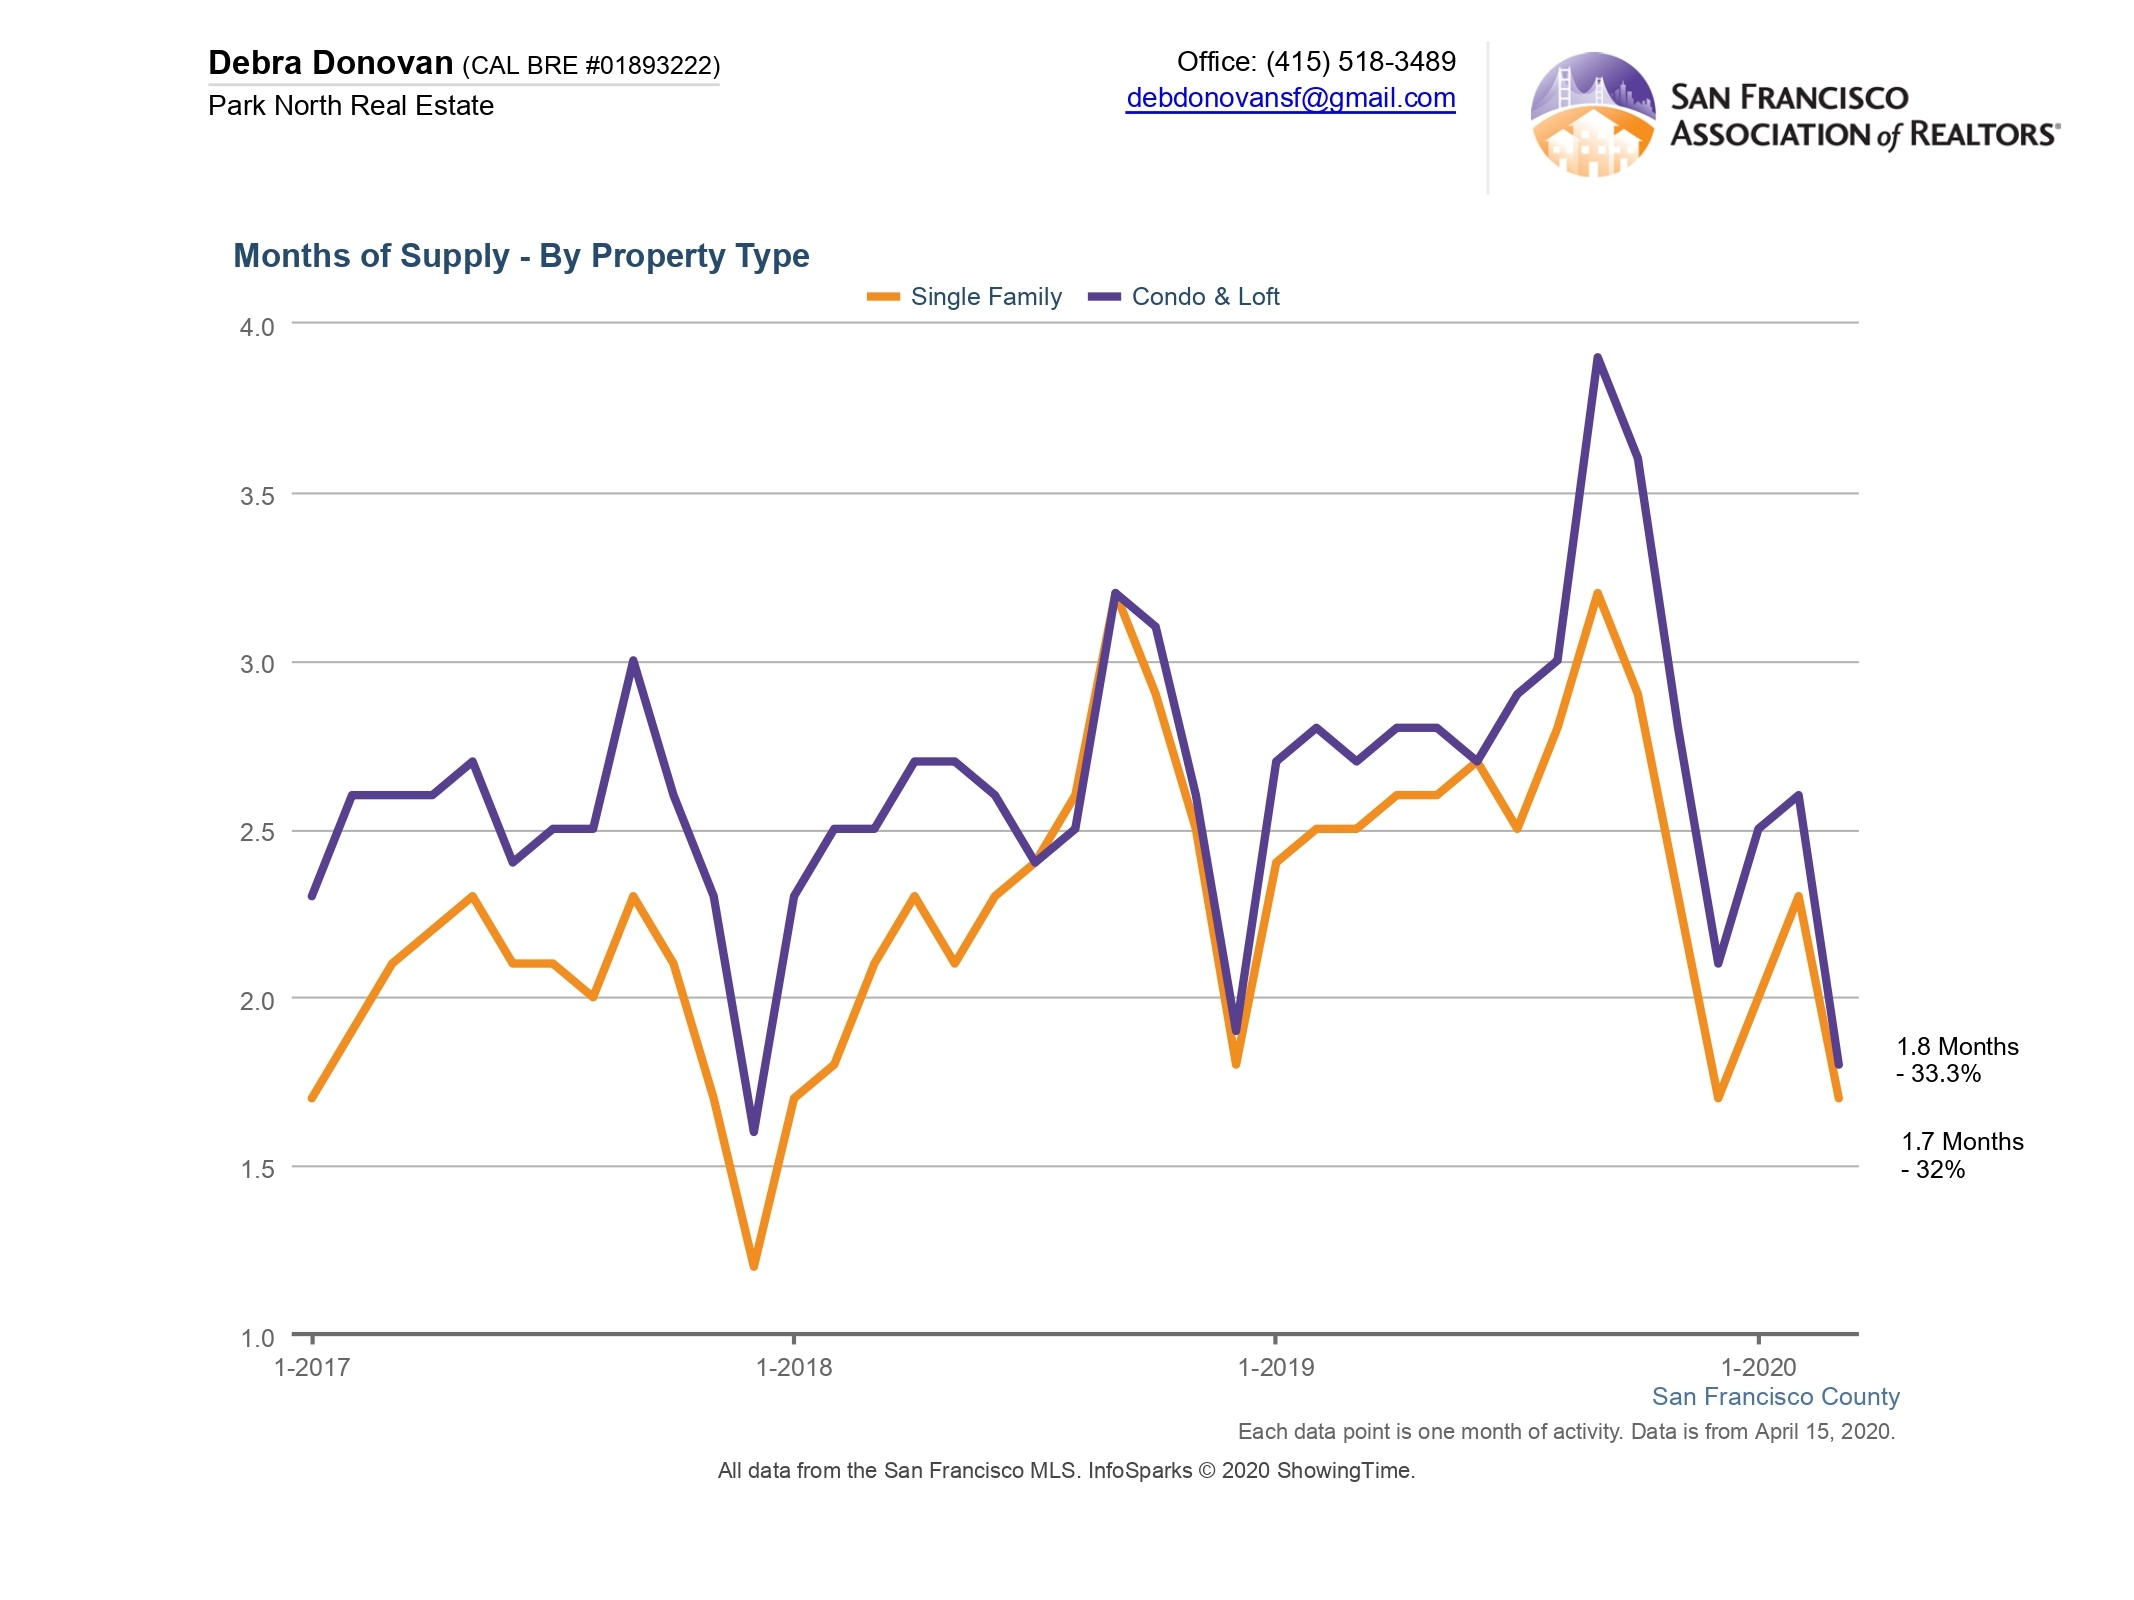
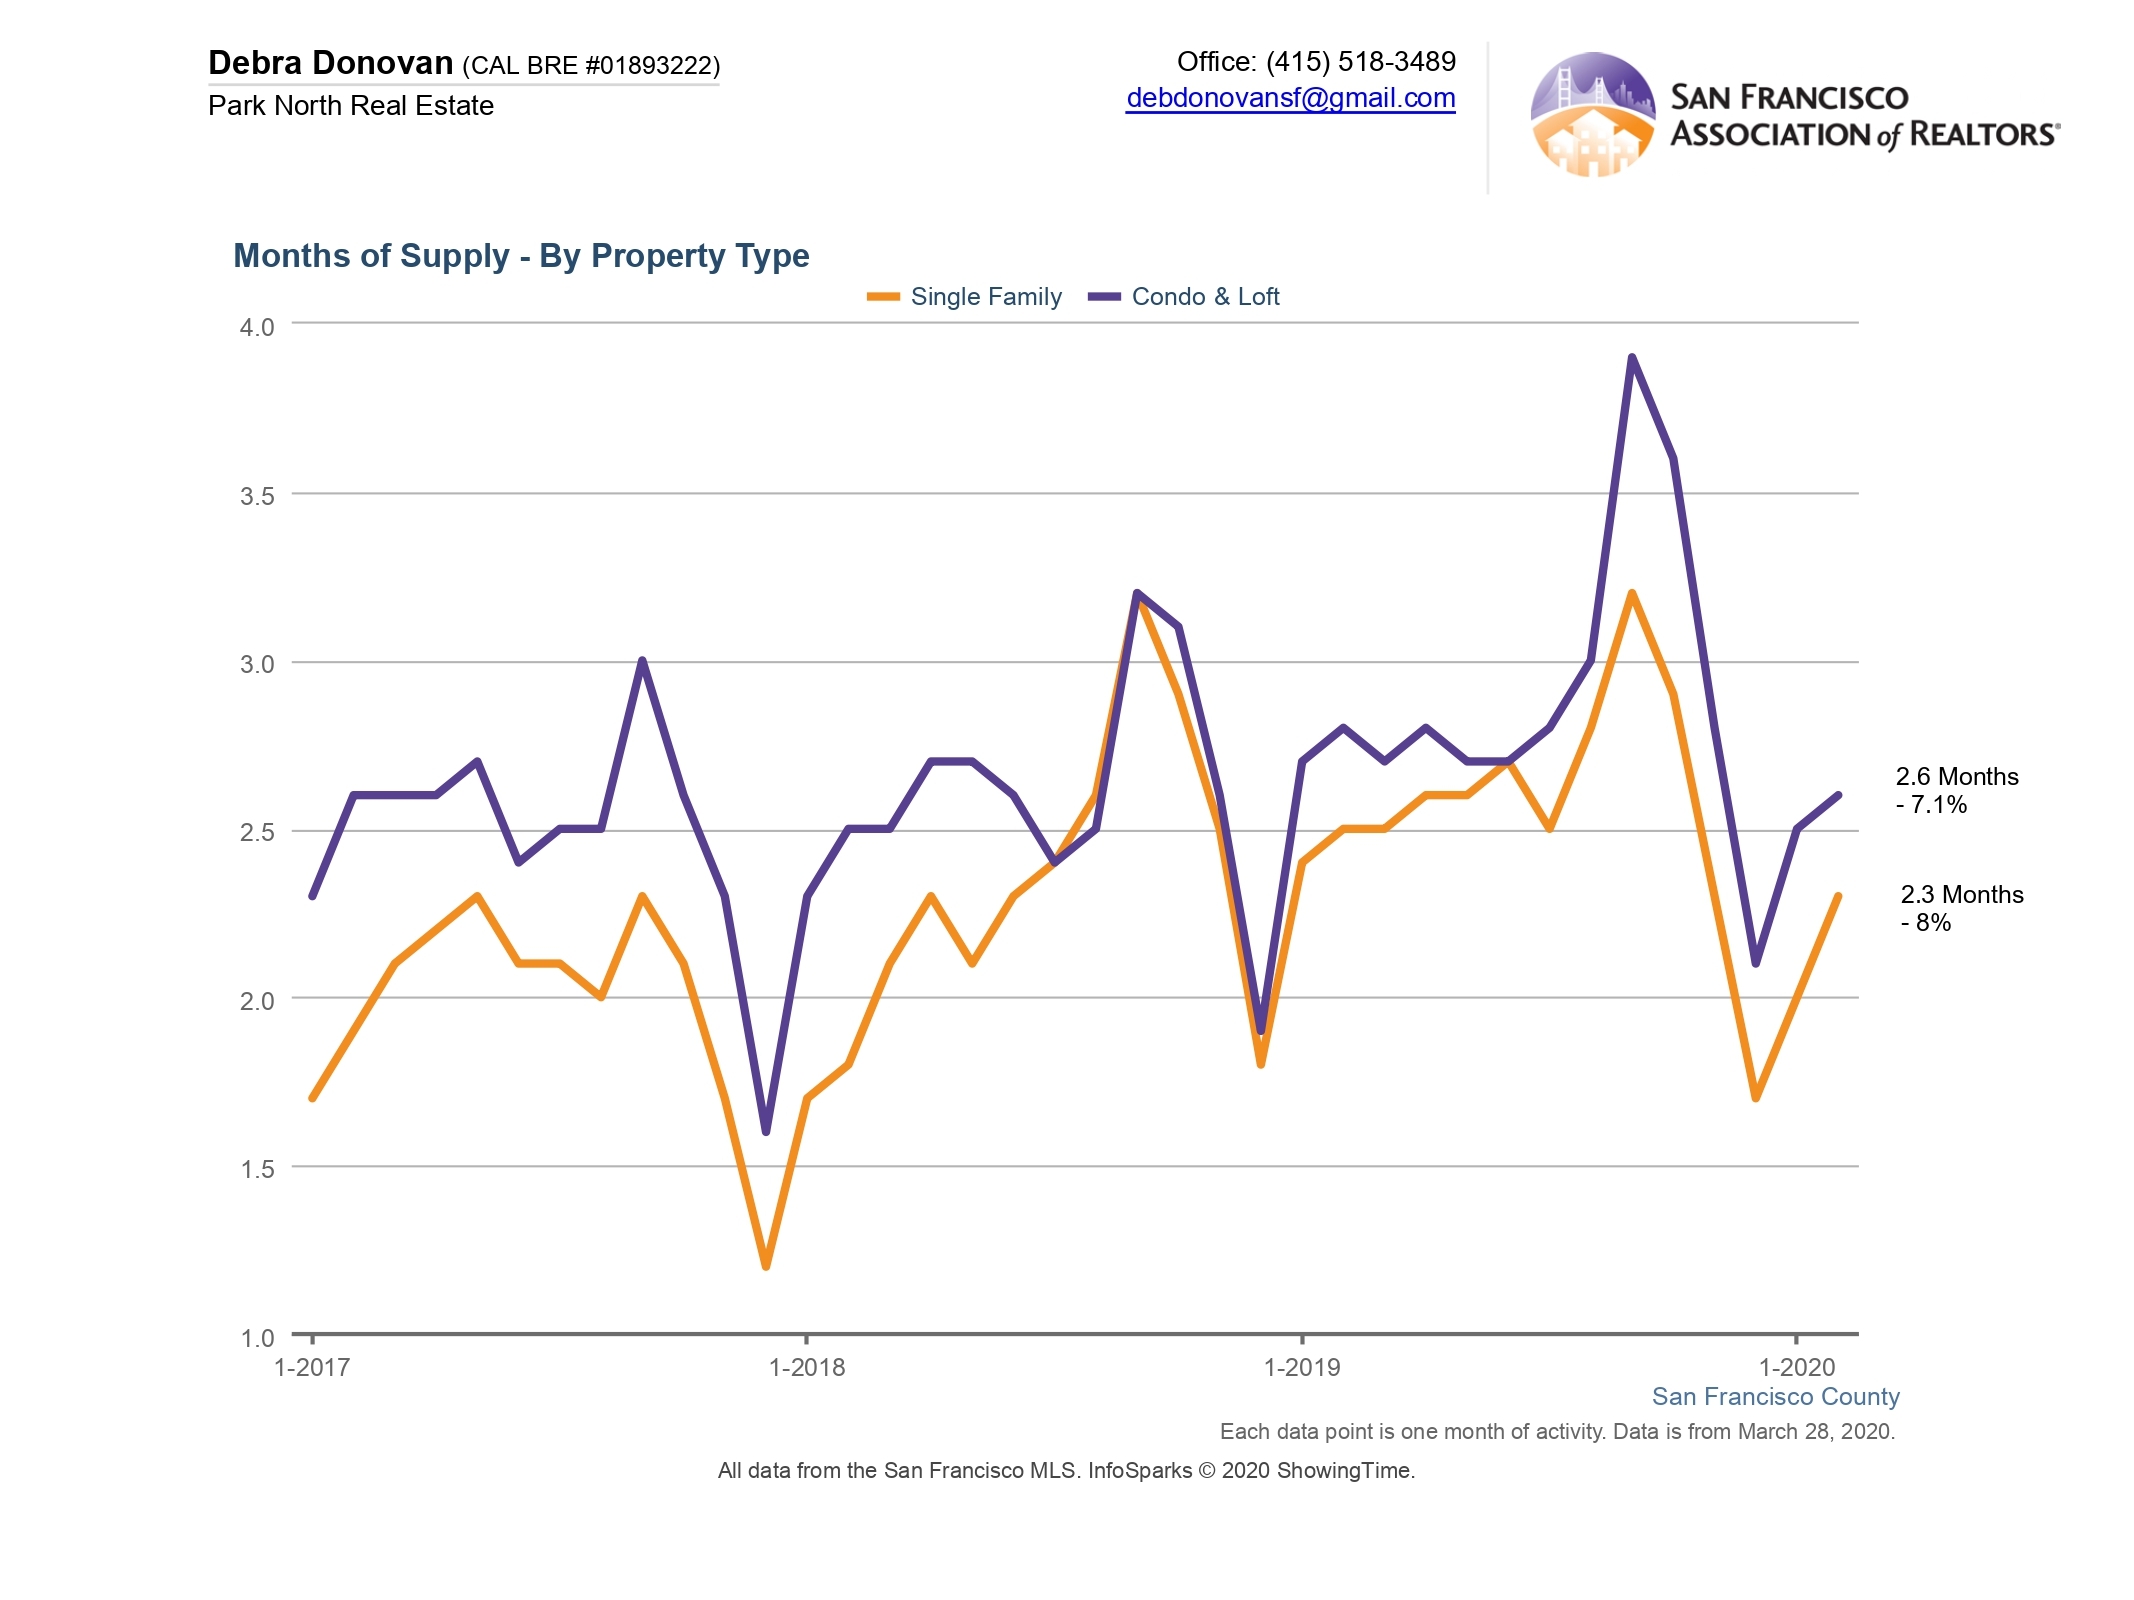
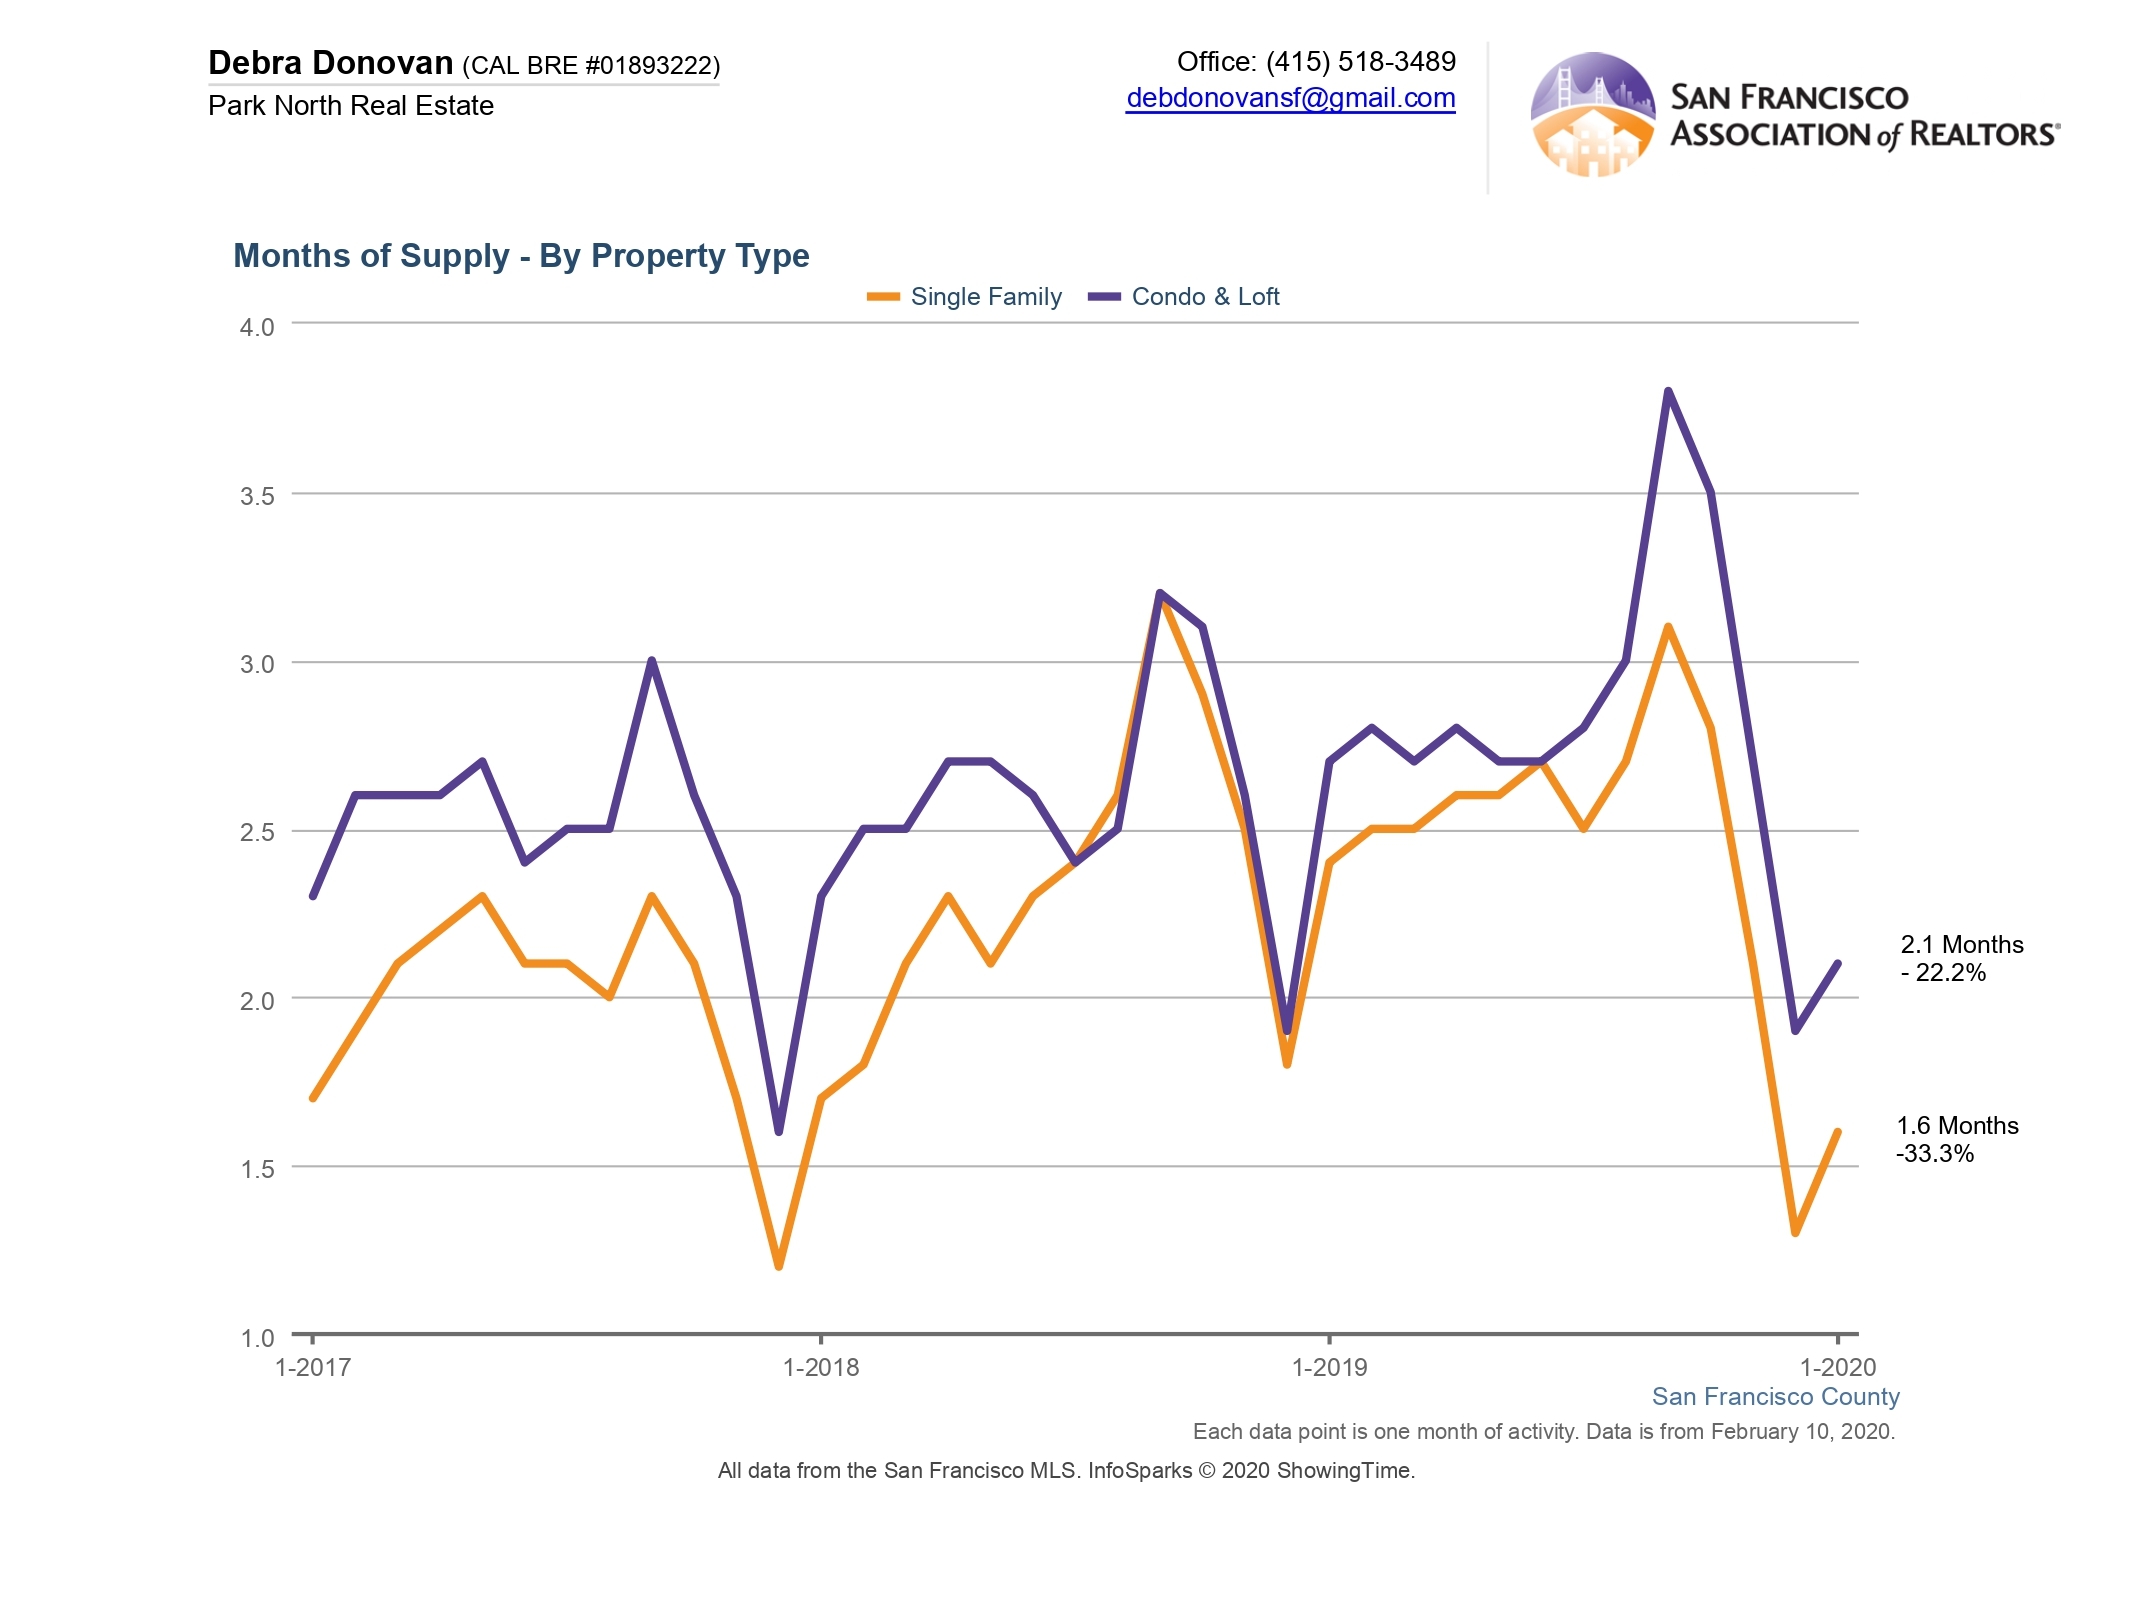
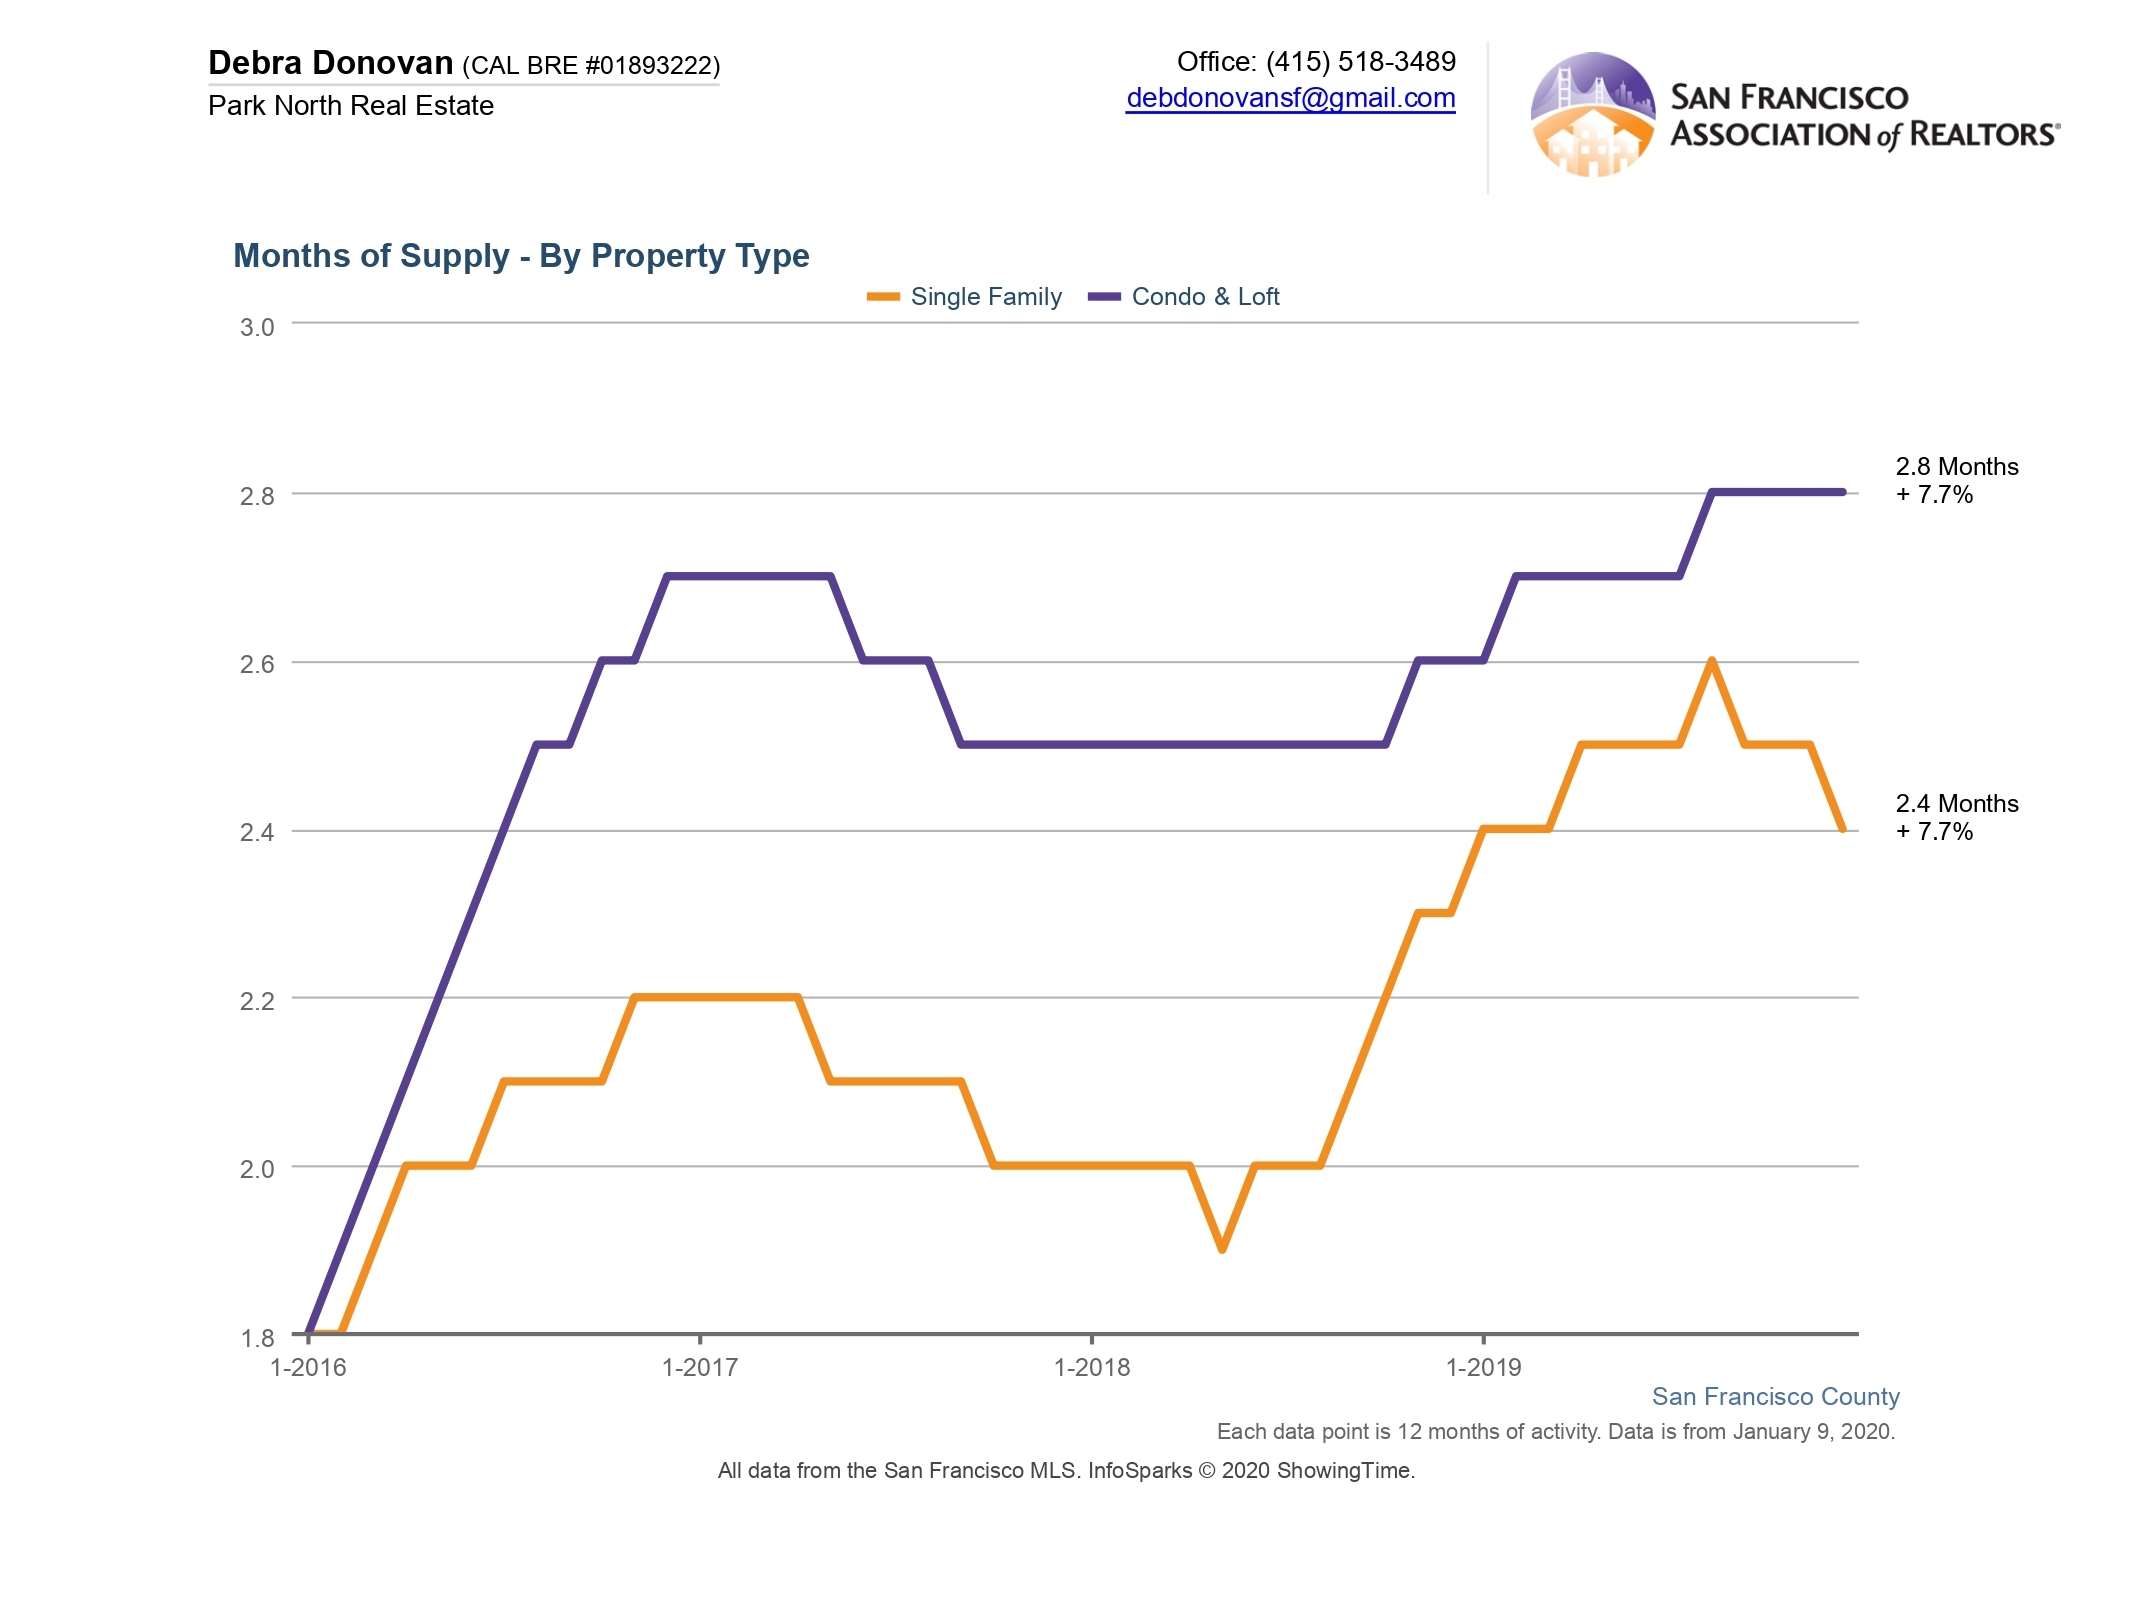
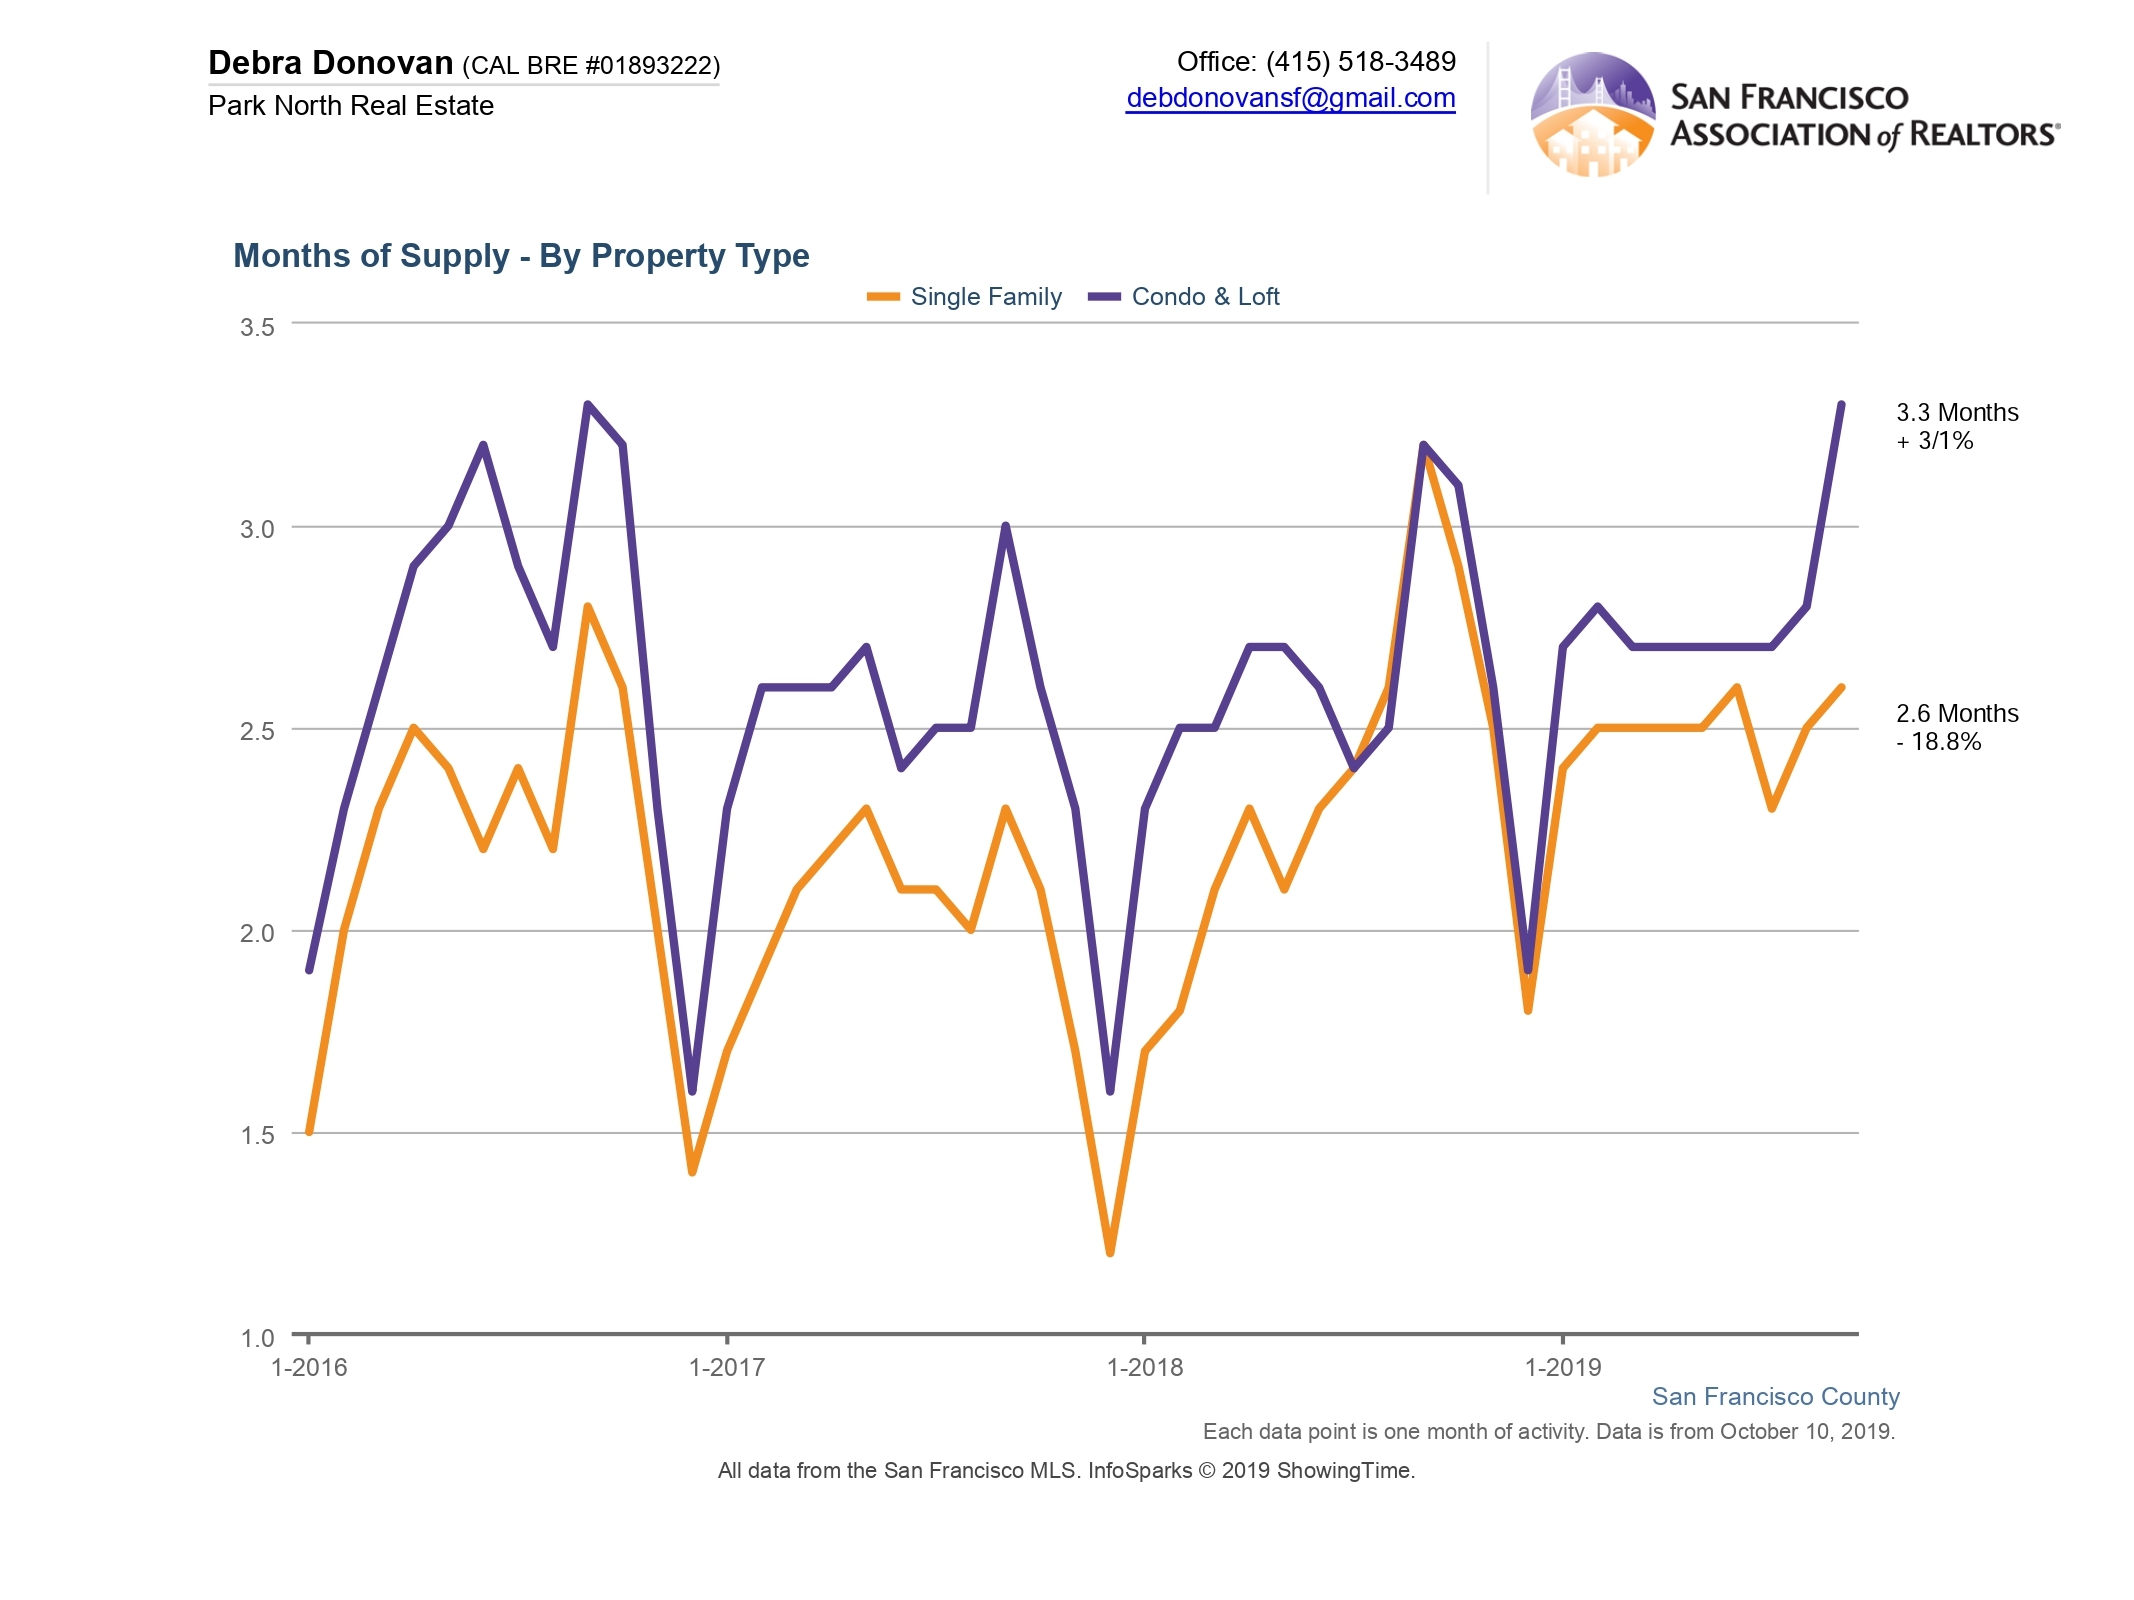
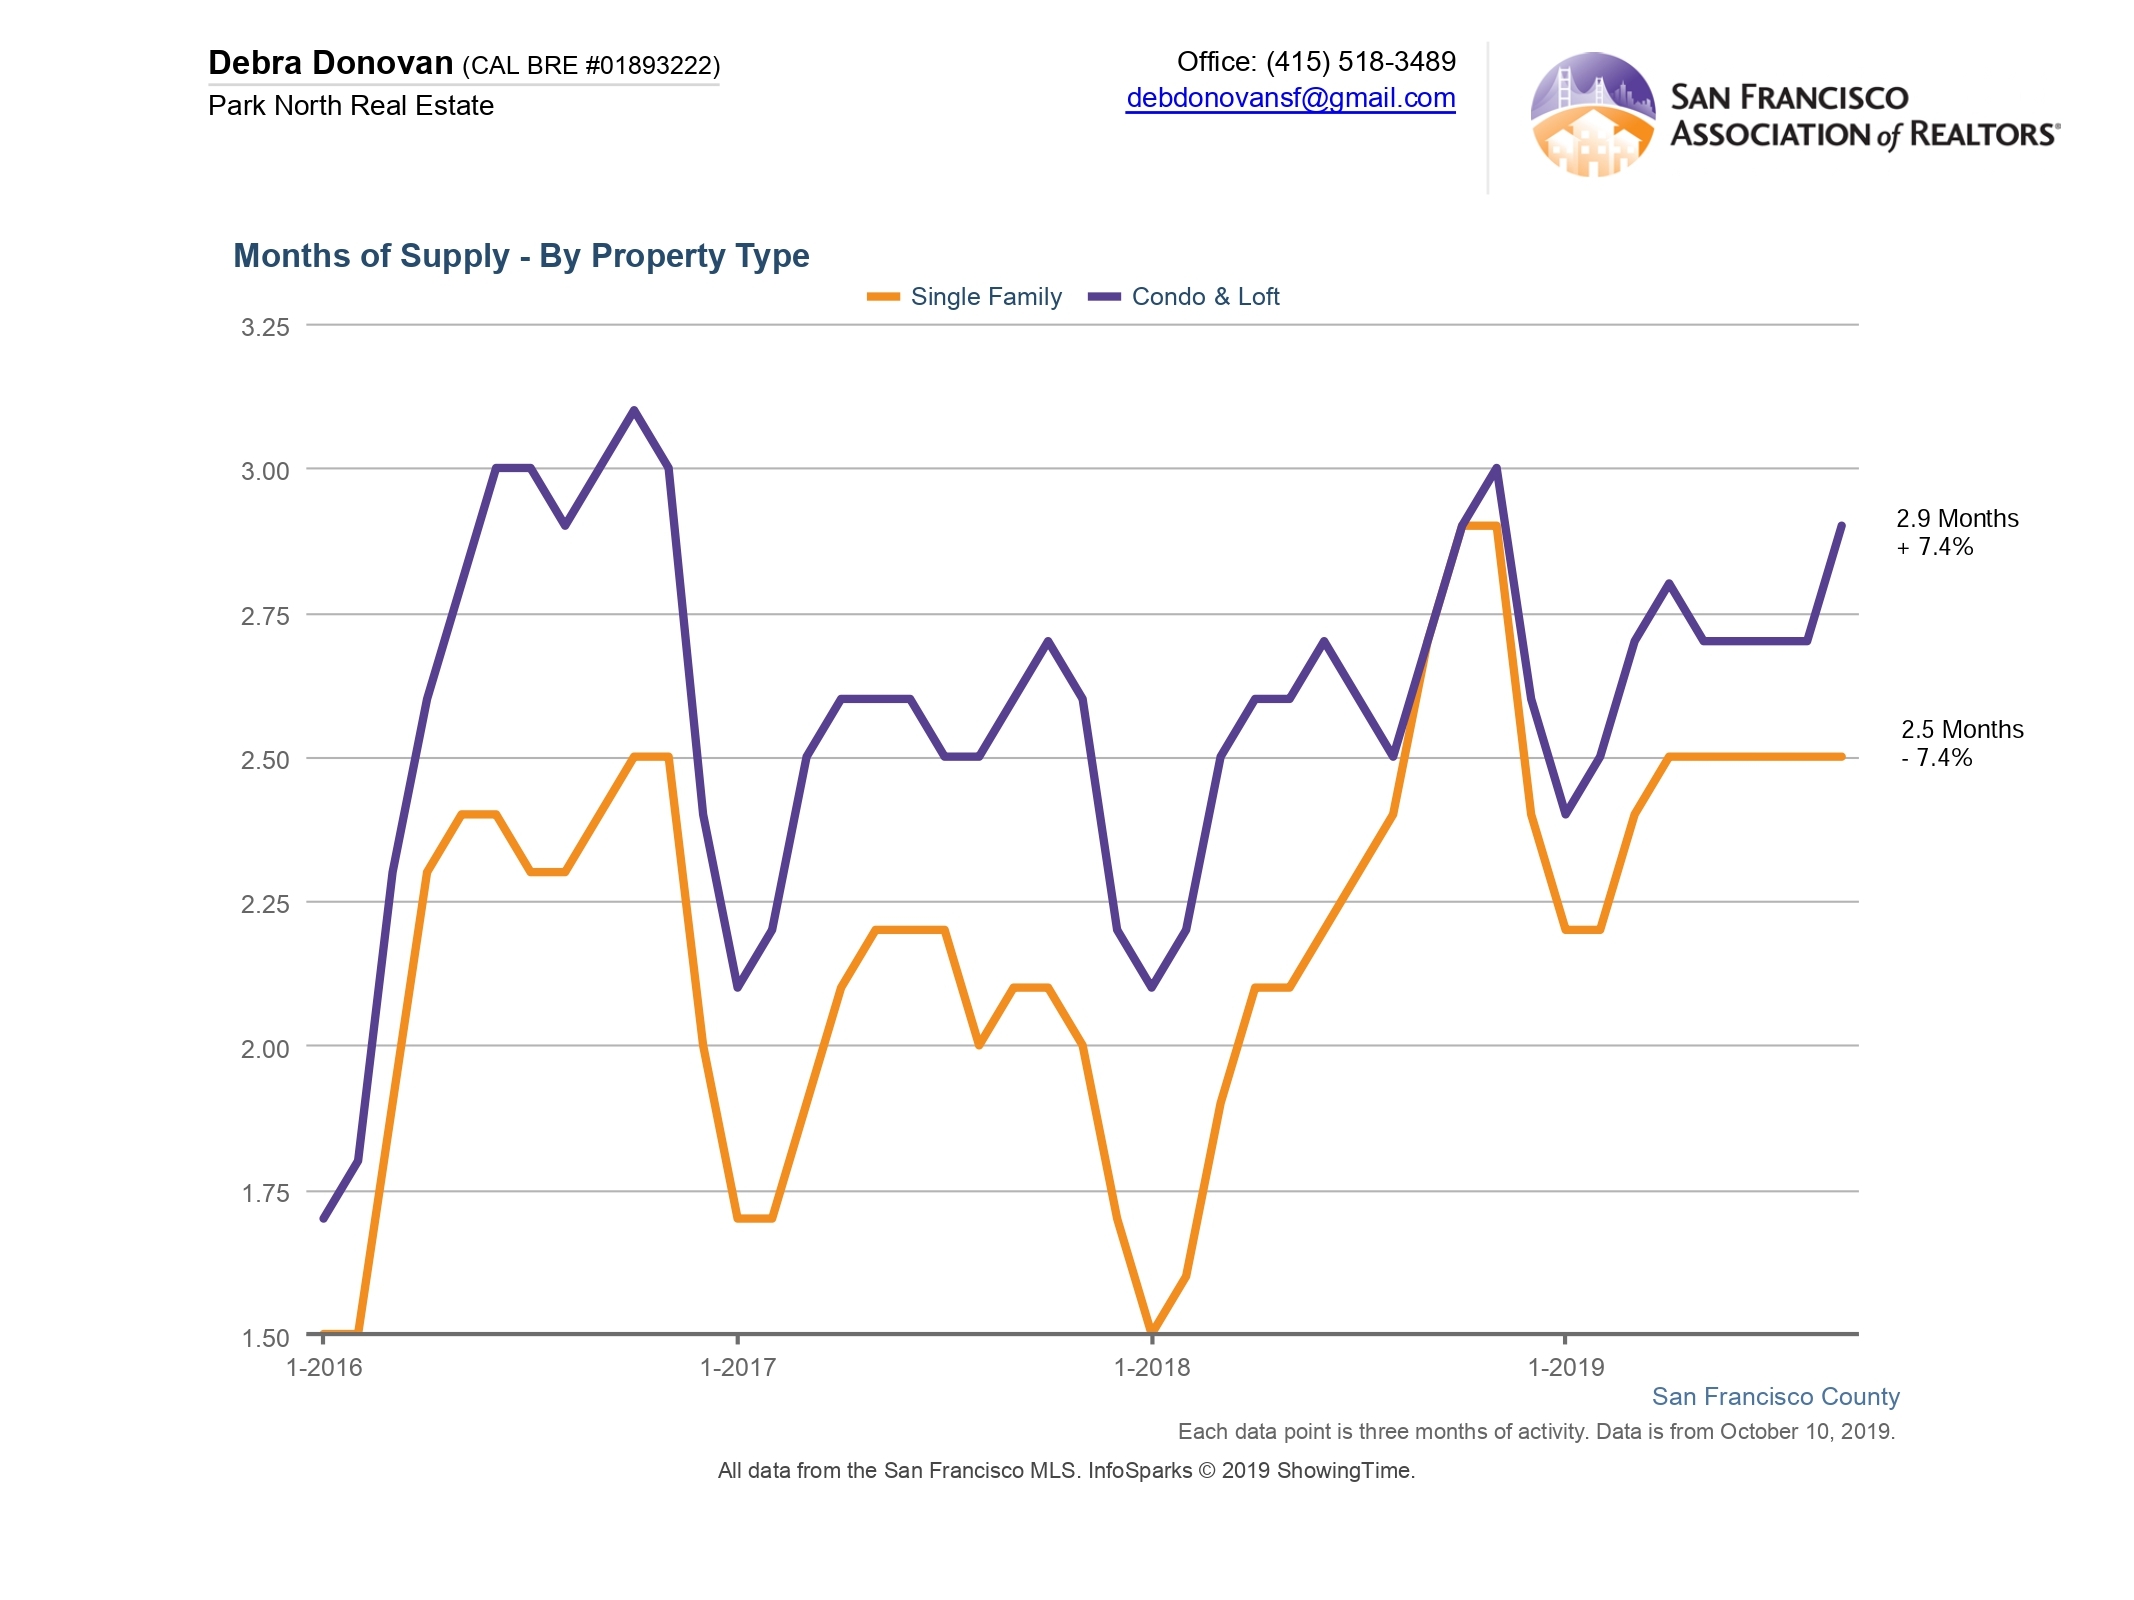
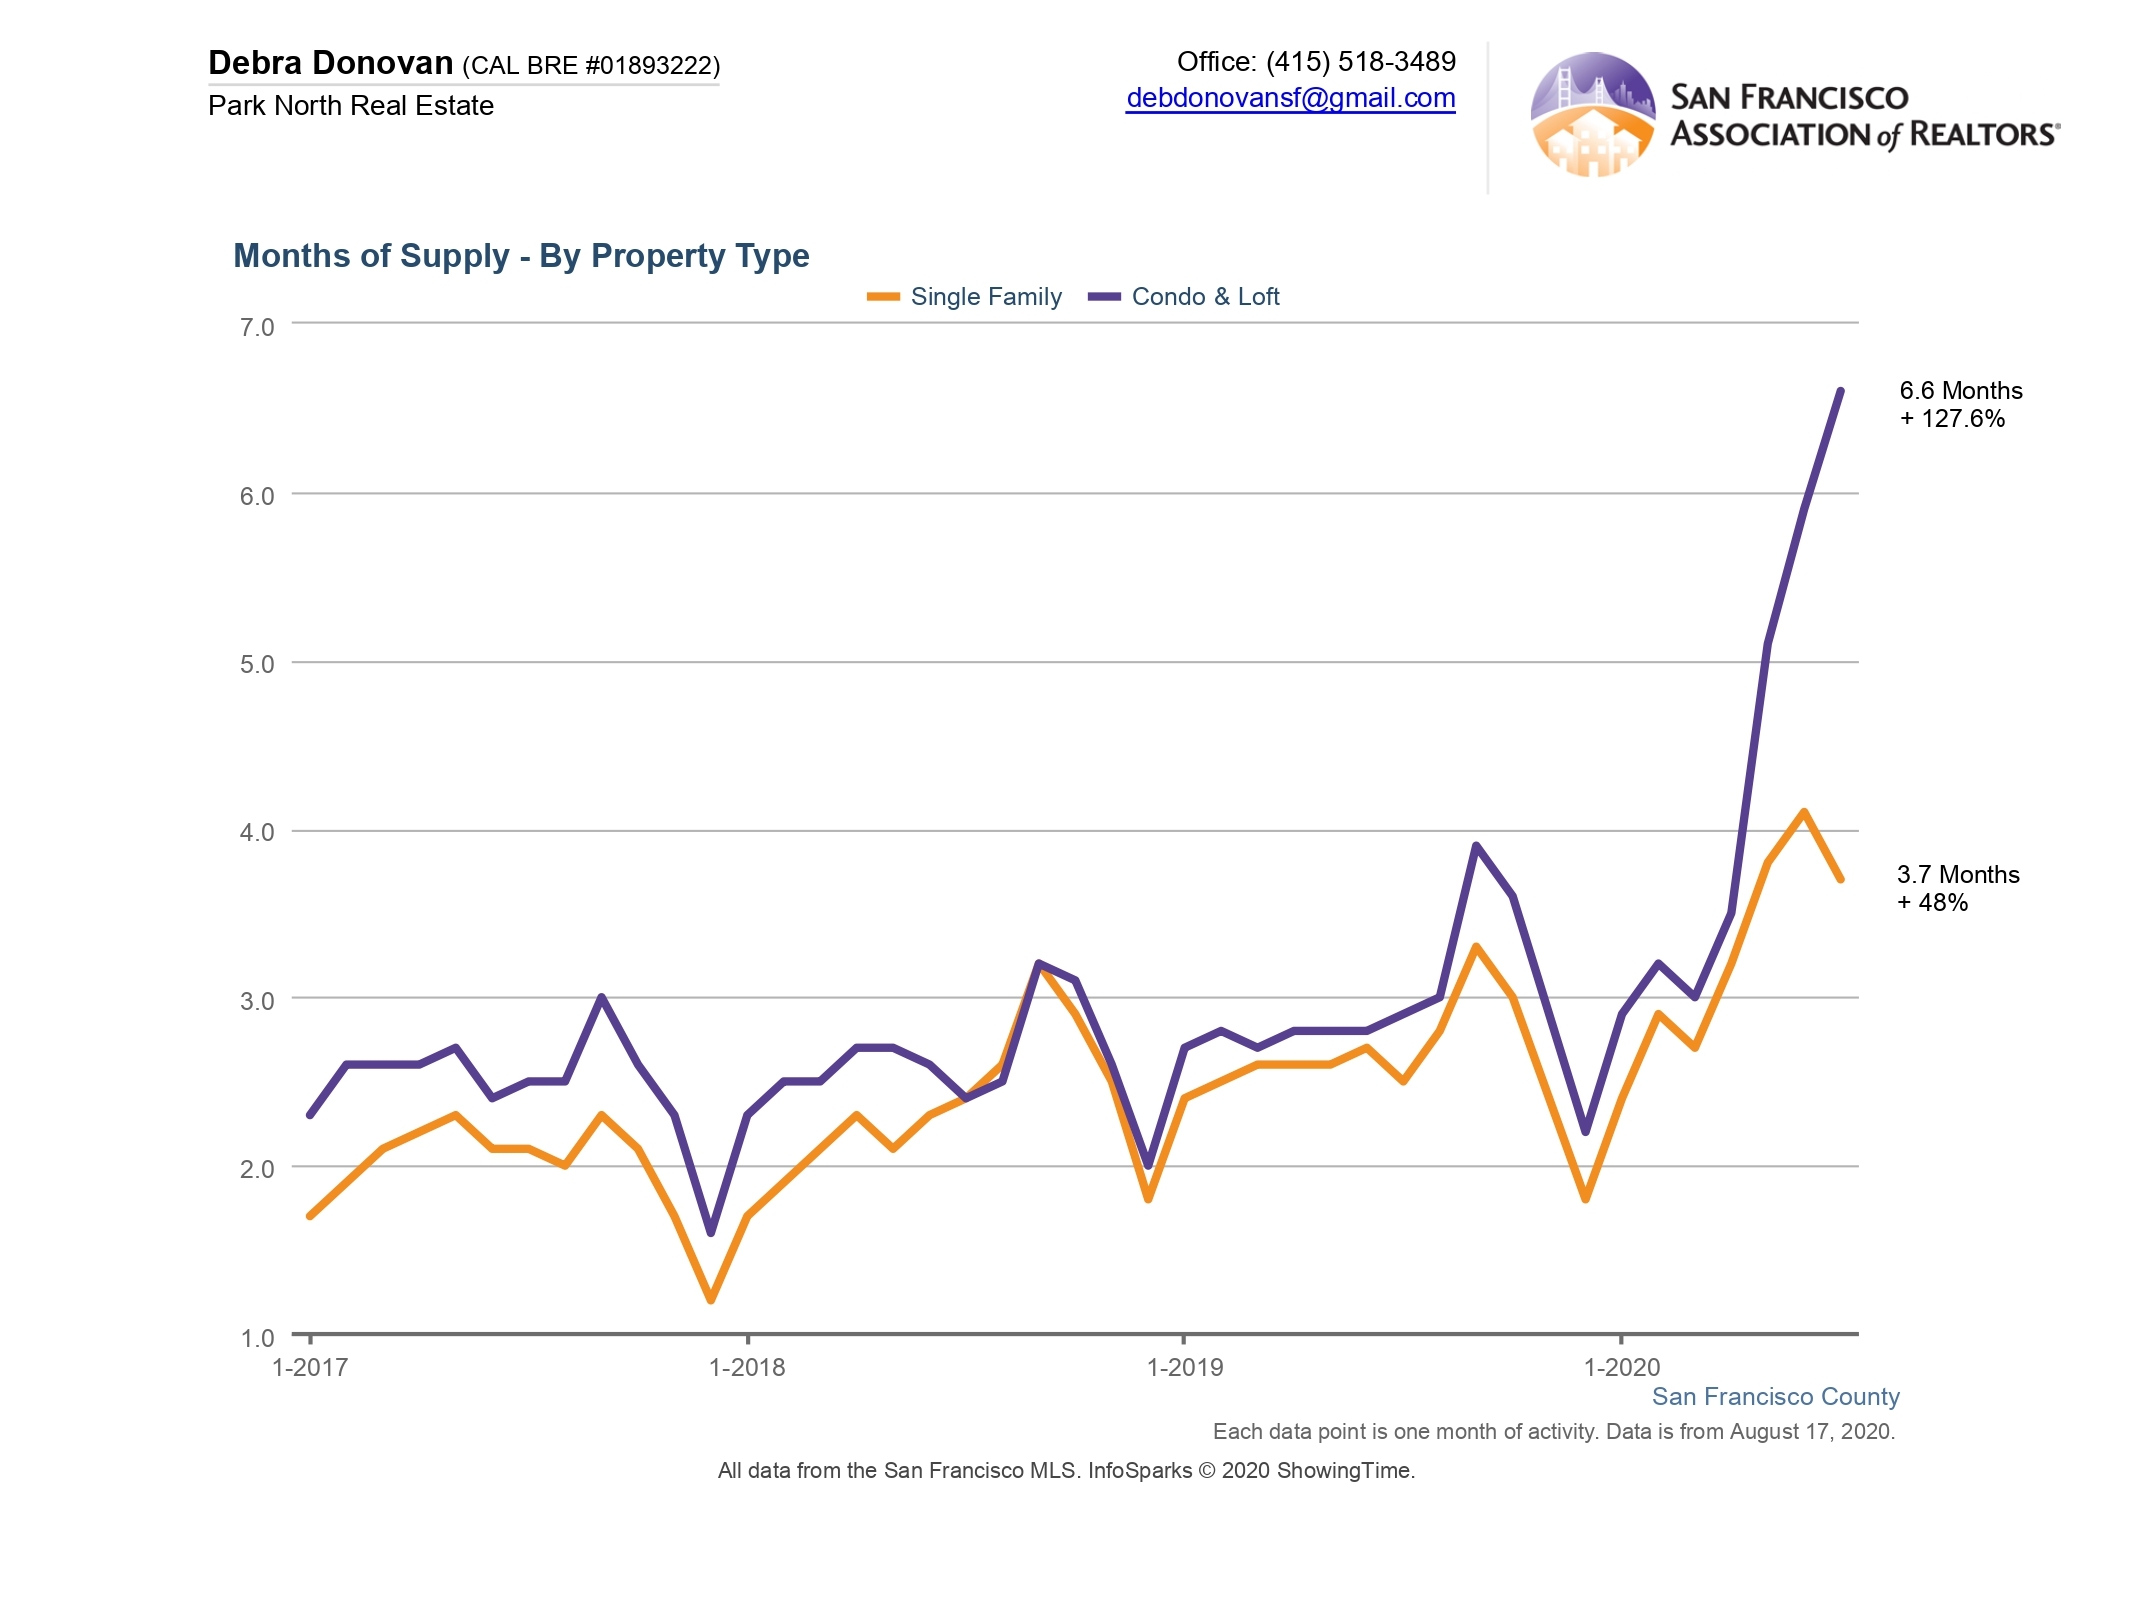
Months Supply of Inventory:
MSI jumped for both single family homes and condos and lofts. Single family homes had 3.7 months of inventory, up 48% compared to July 2019. Condos and lofts leapt to 6.6 months of inventory, a whopping 127% year-over-year increase. It’s important to note here that this does not represent all areas of the City. Neighborhoods that like South of Market and South Beach had more than 8 months of inventory, while Pacific Heights, Noe Valley and North Panhandle had around 3.5 months.
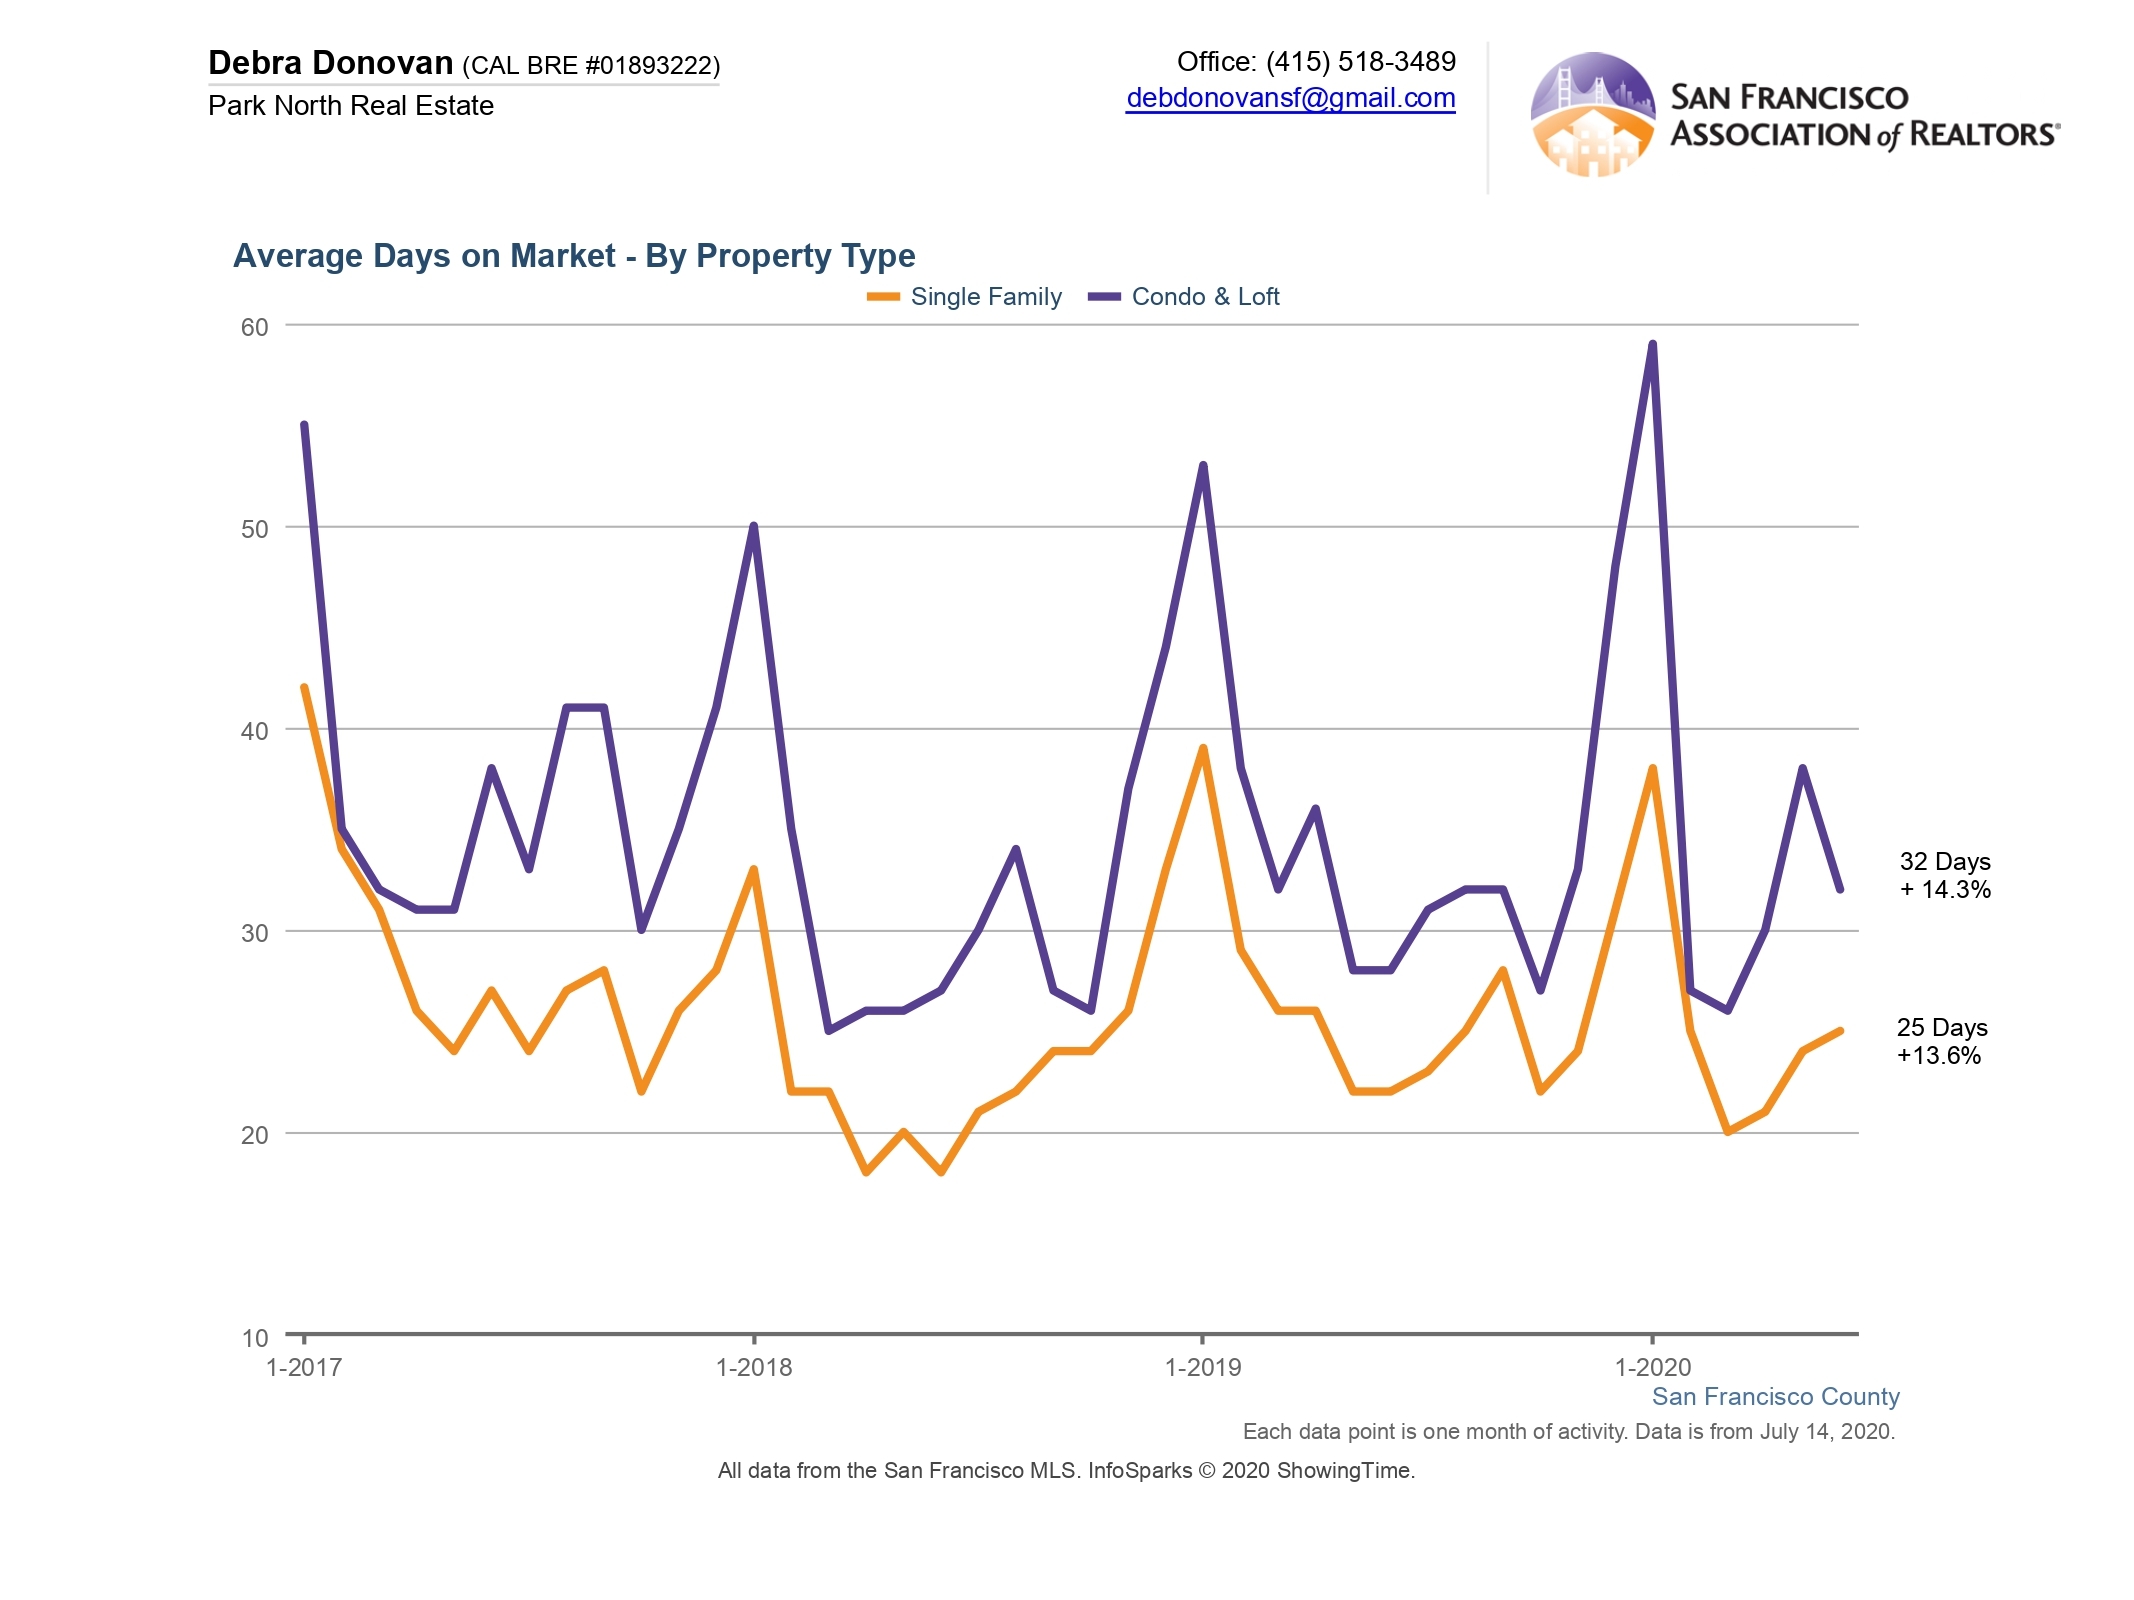
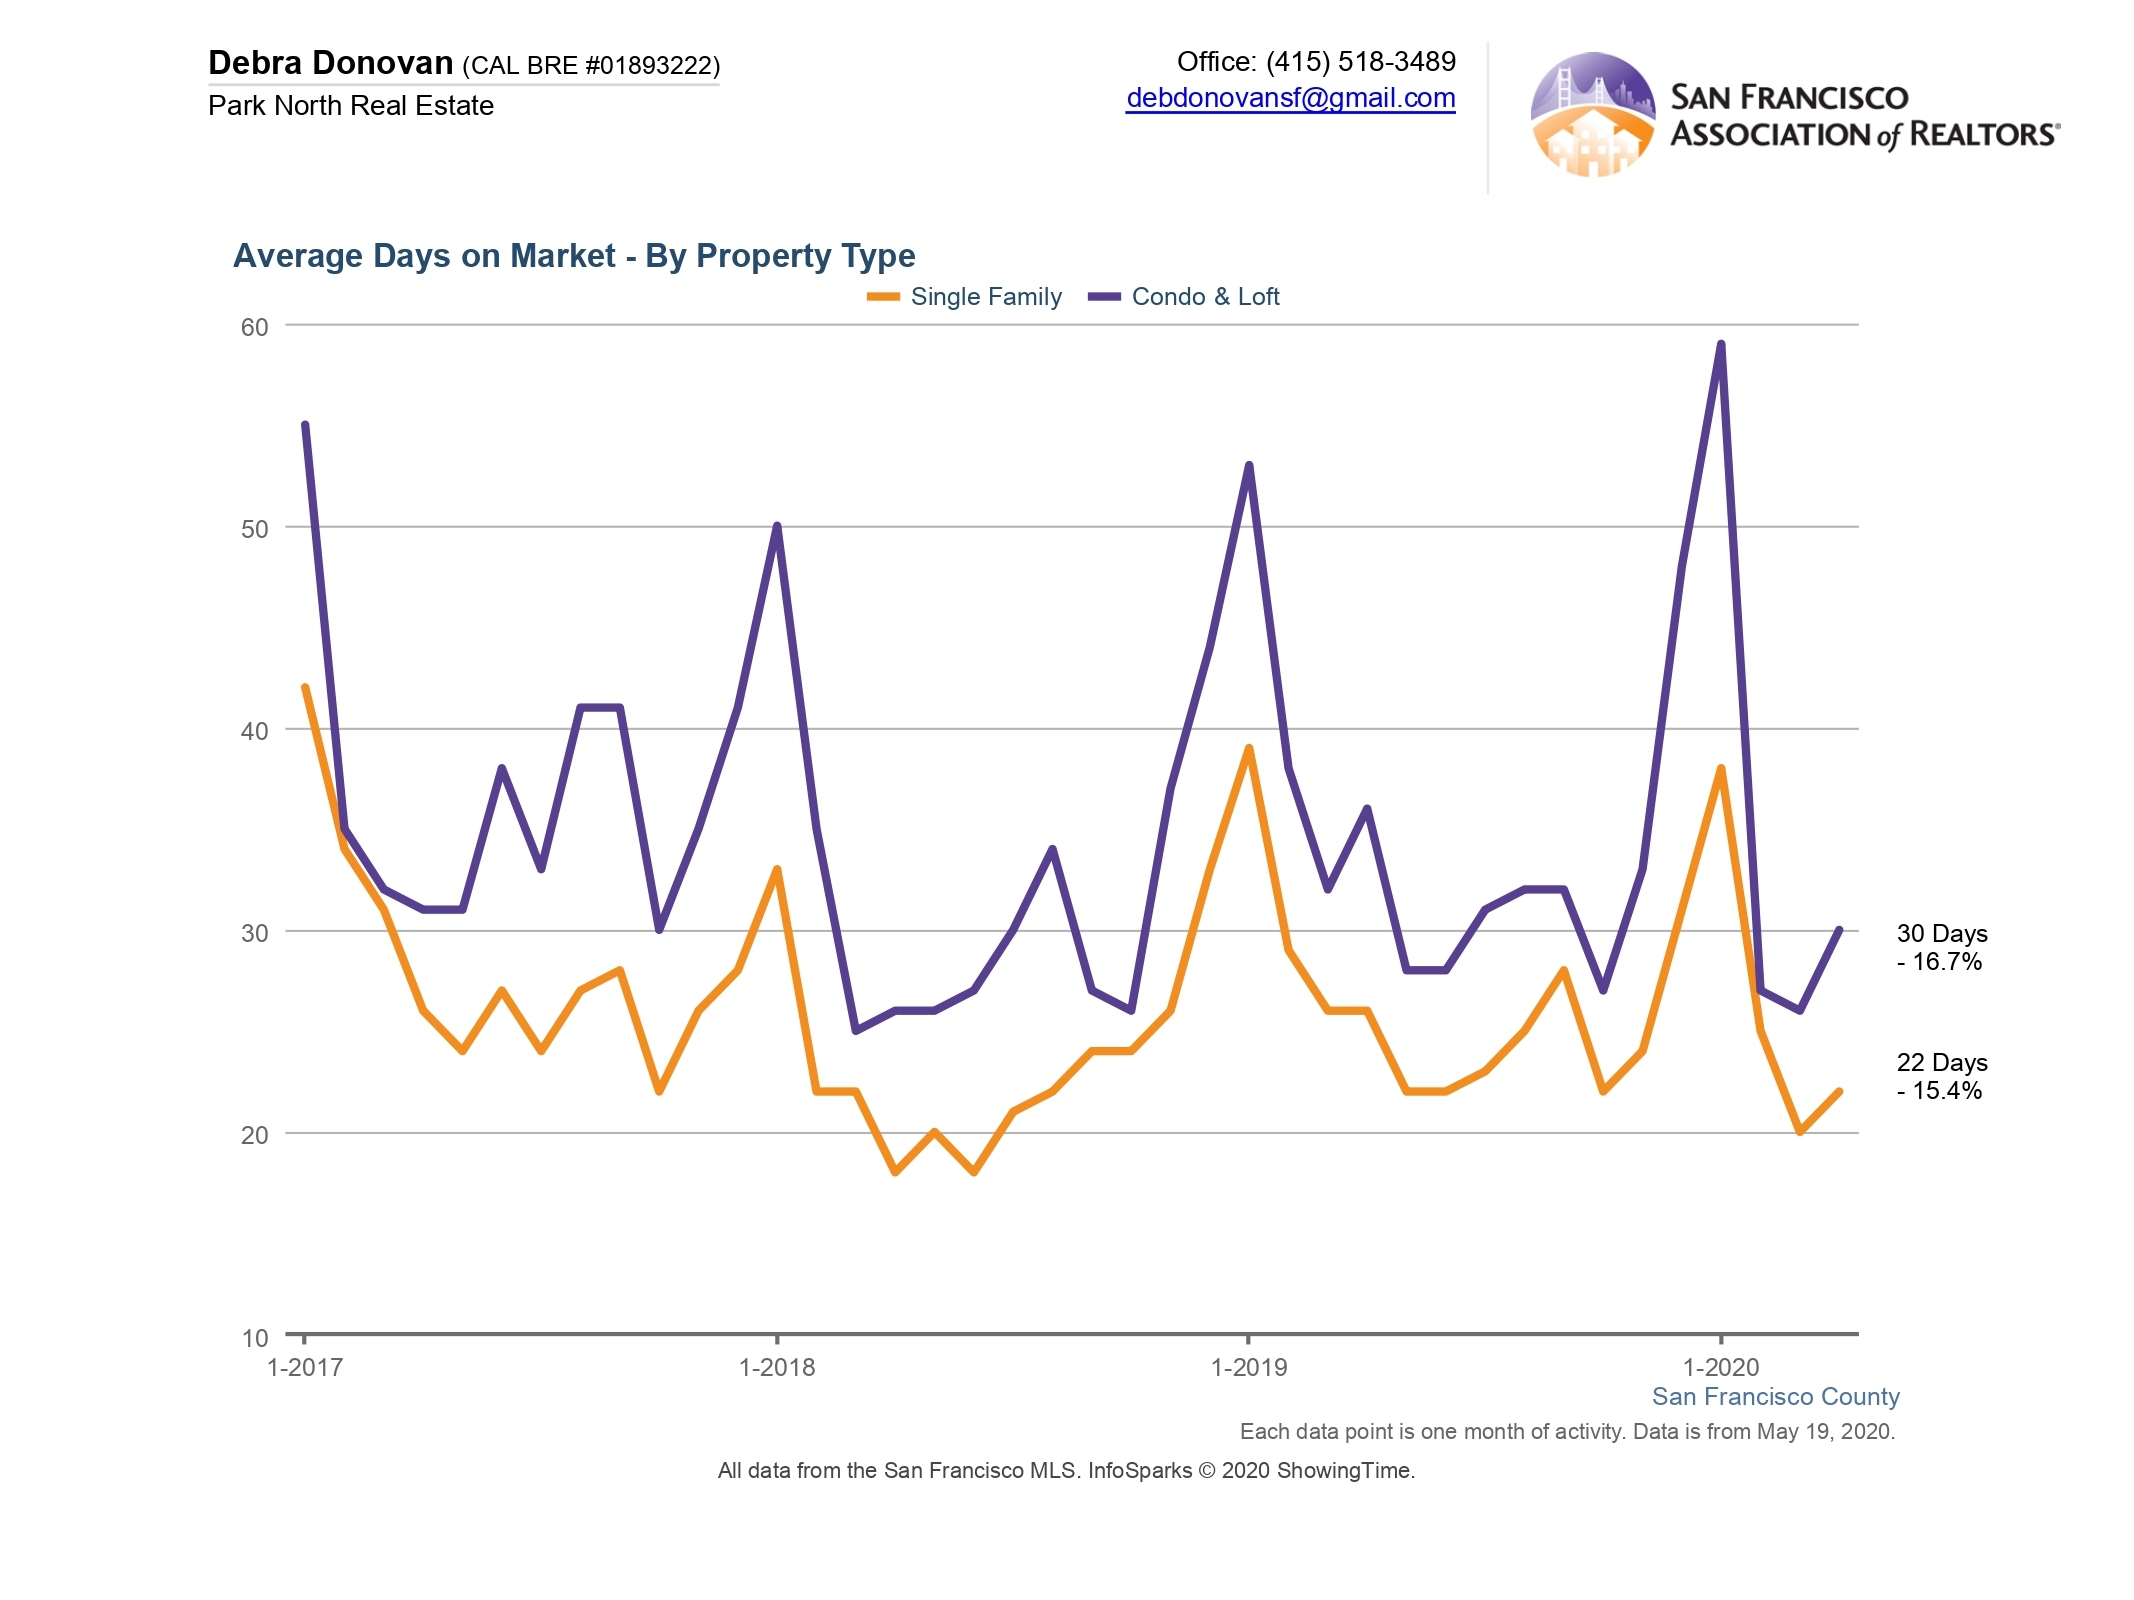
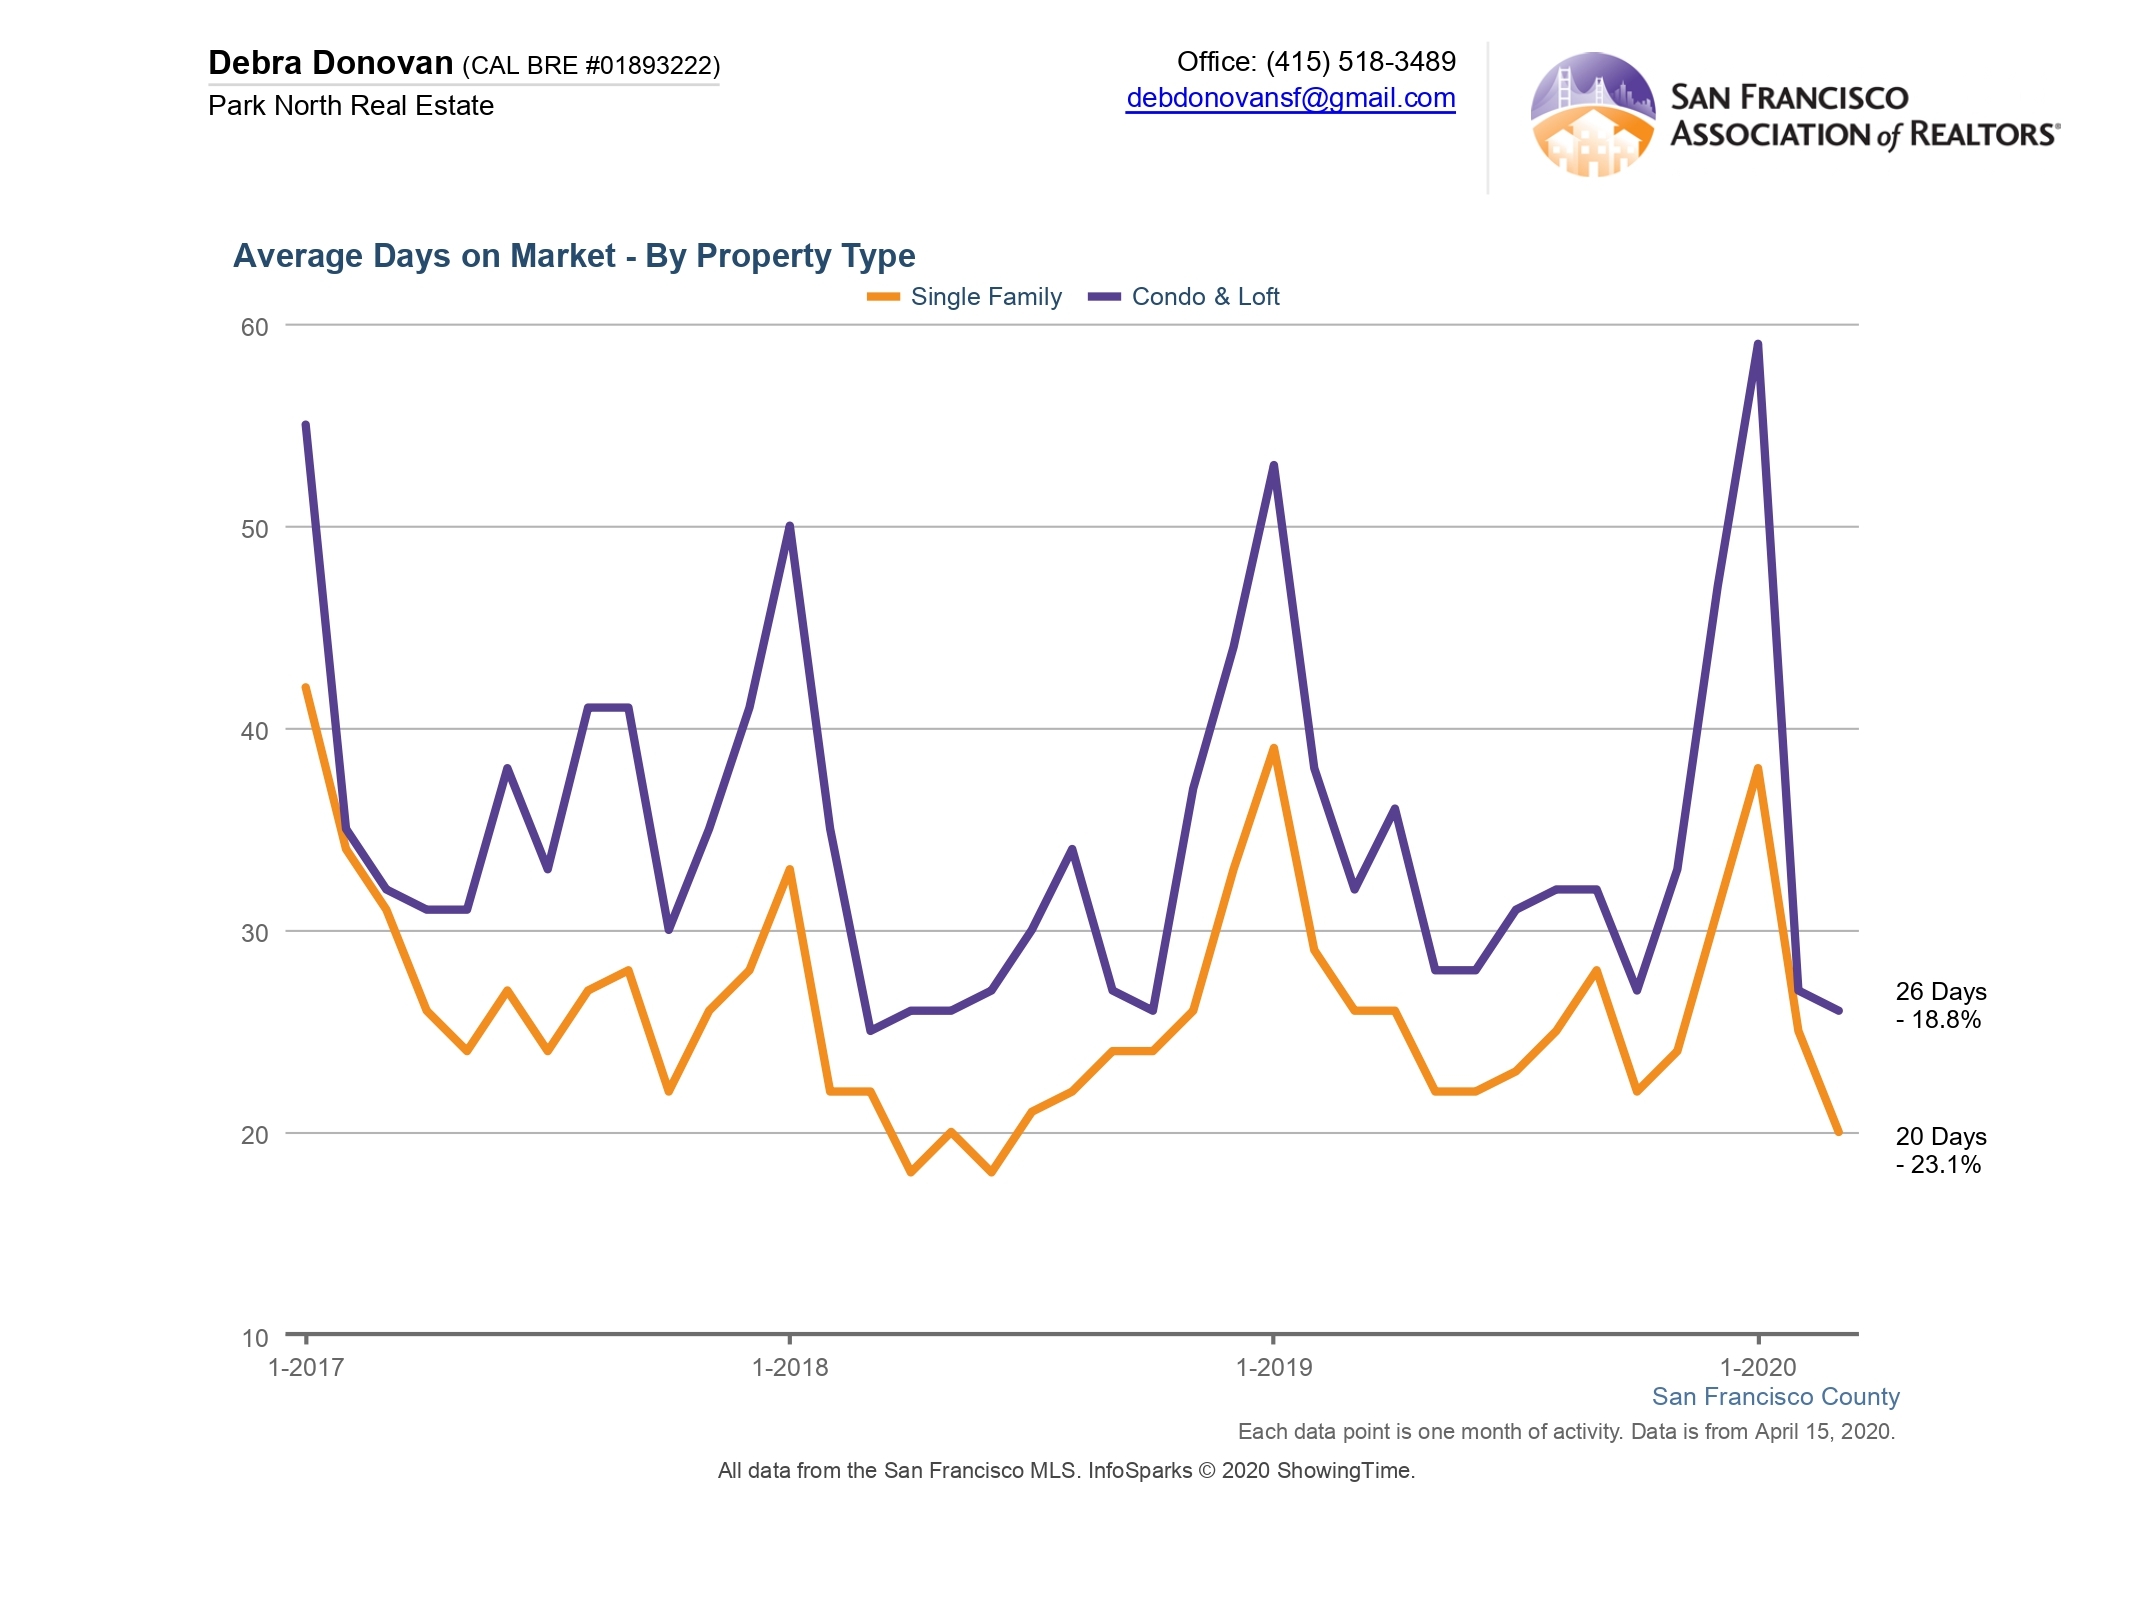
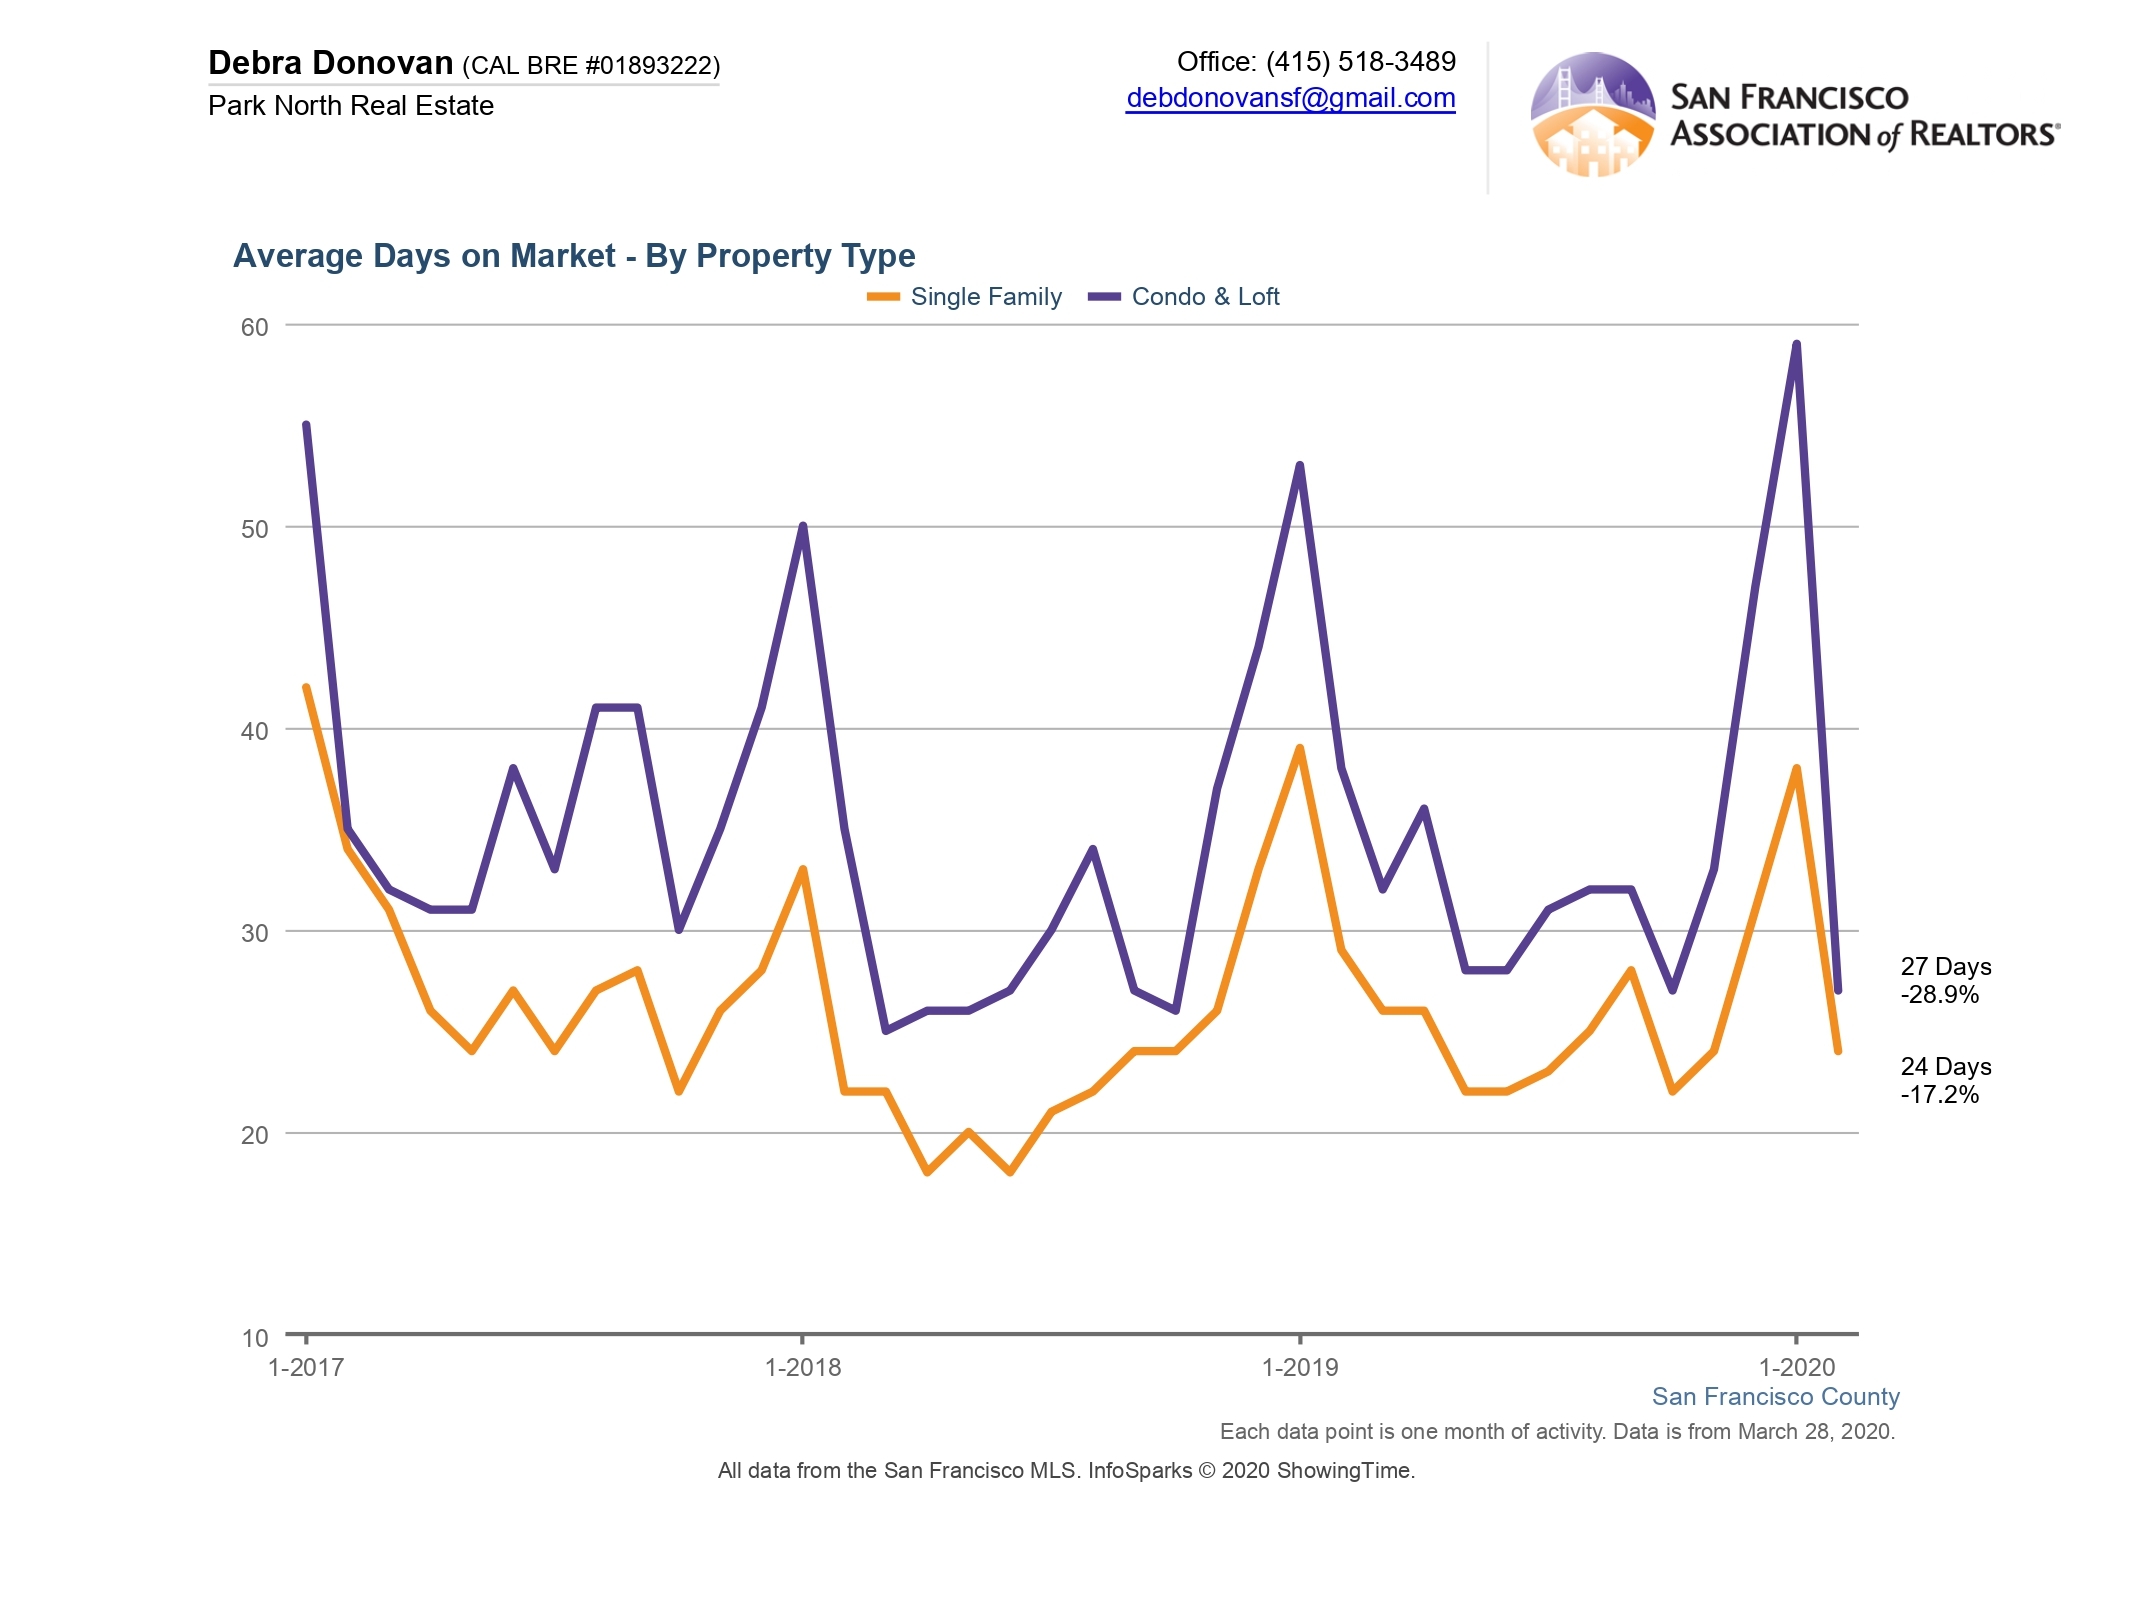
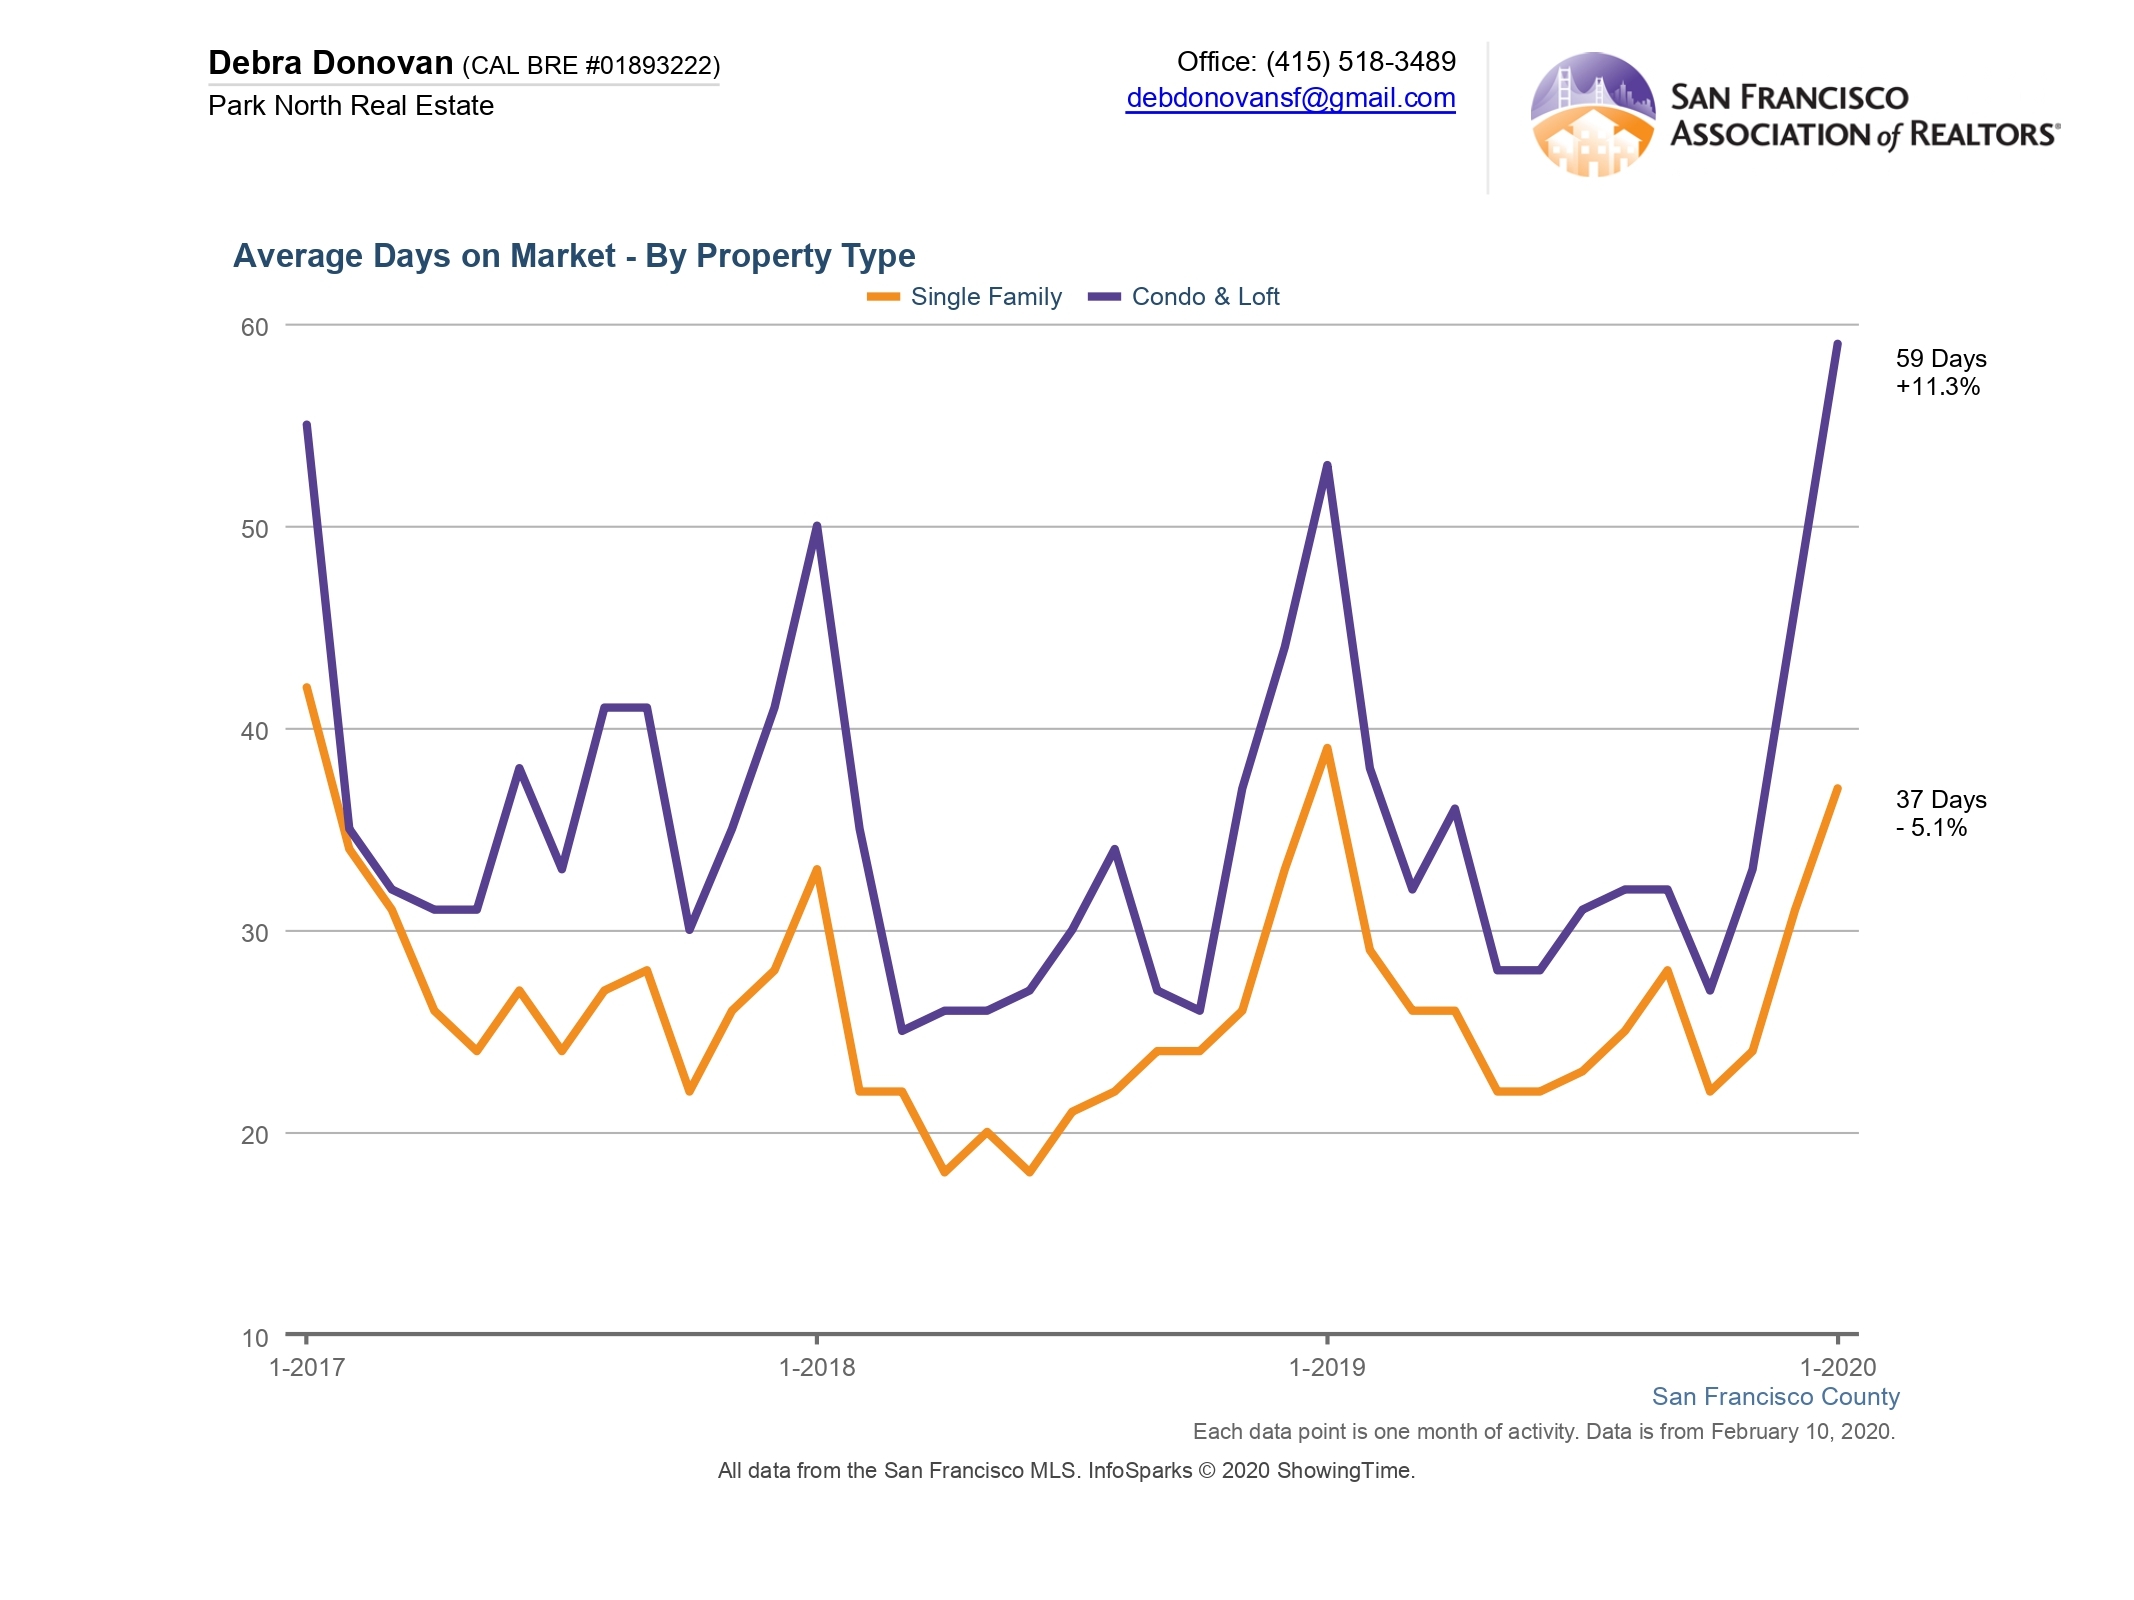
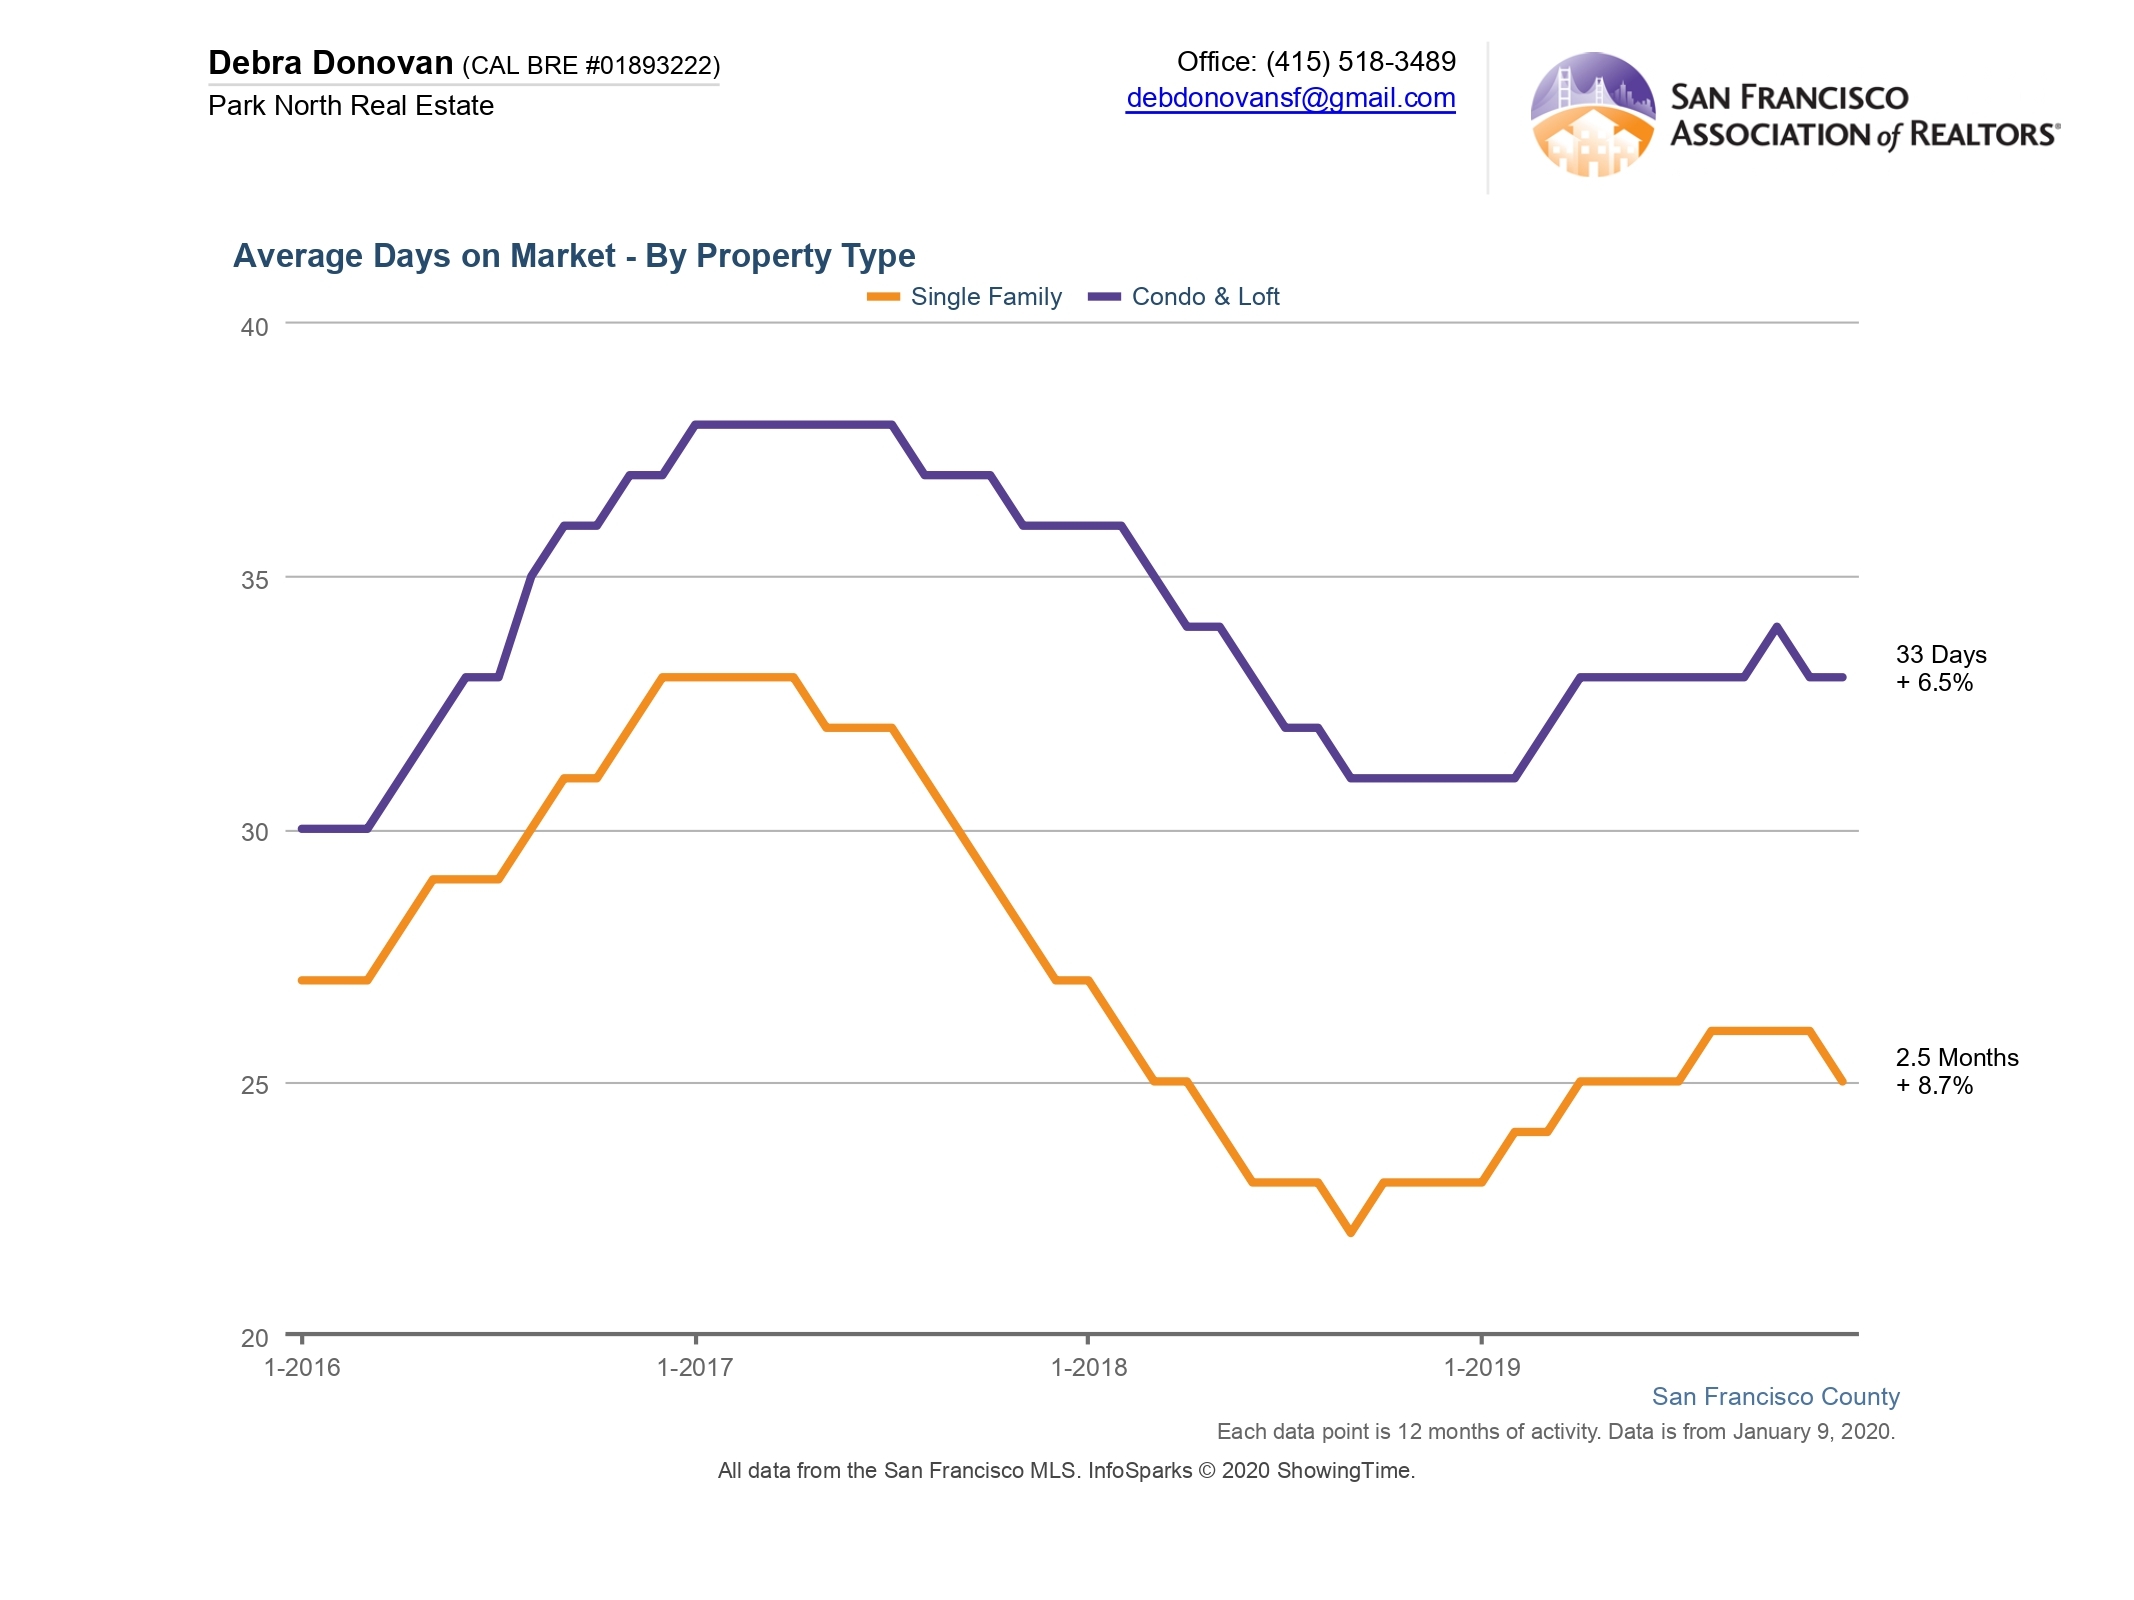
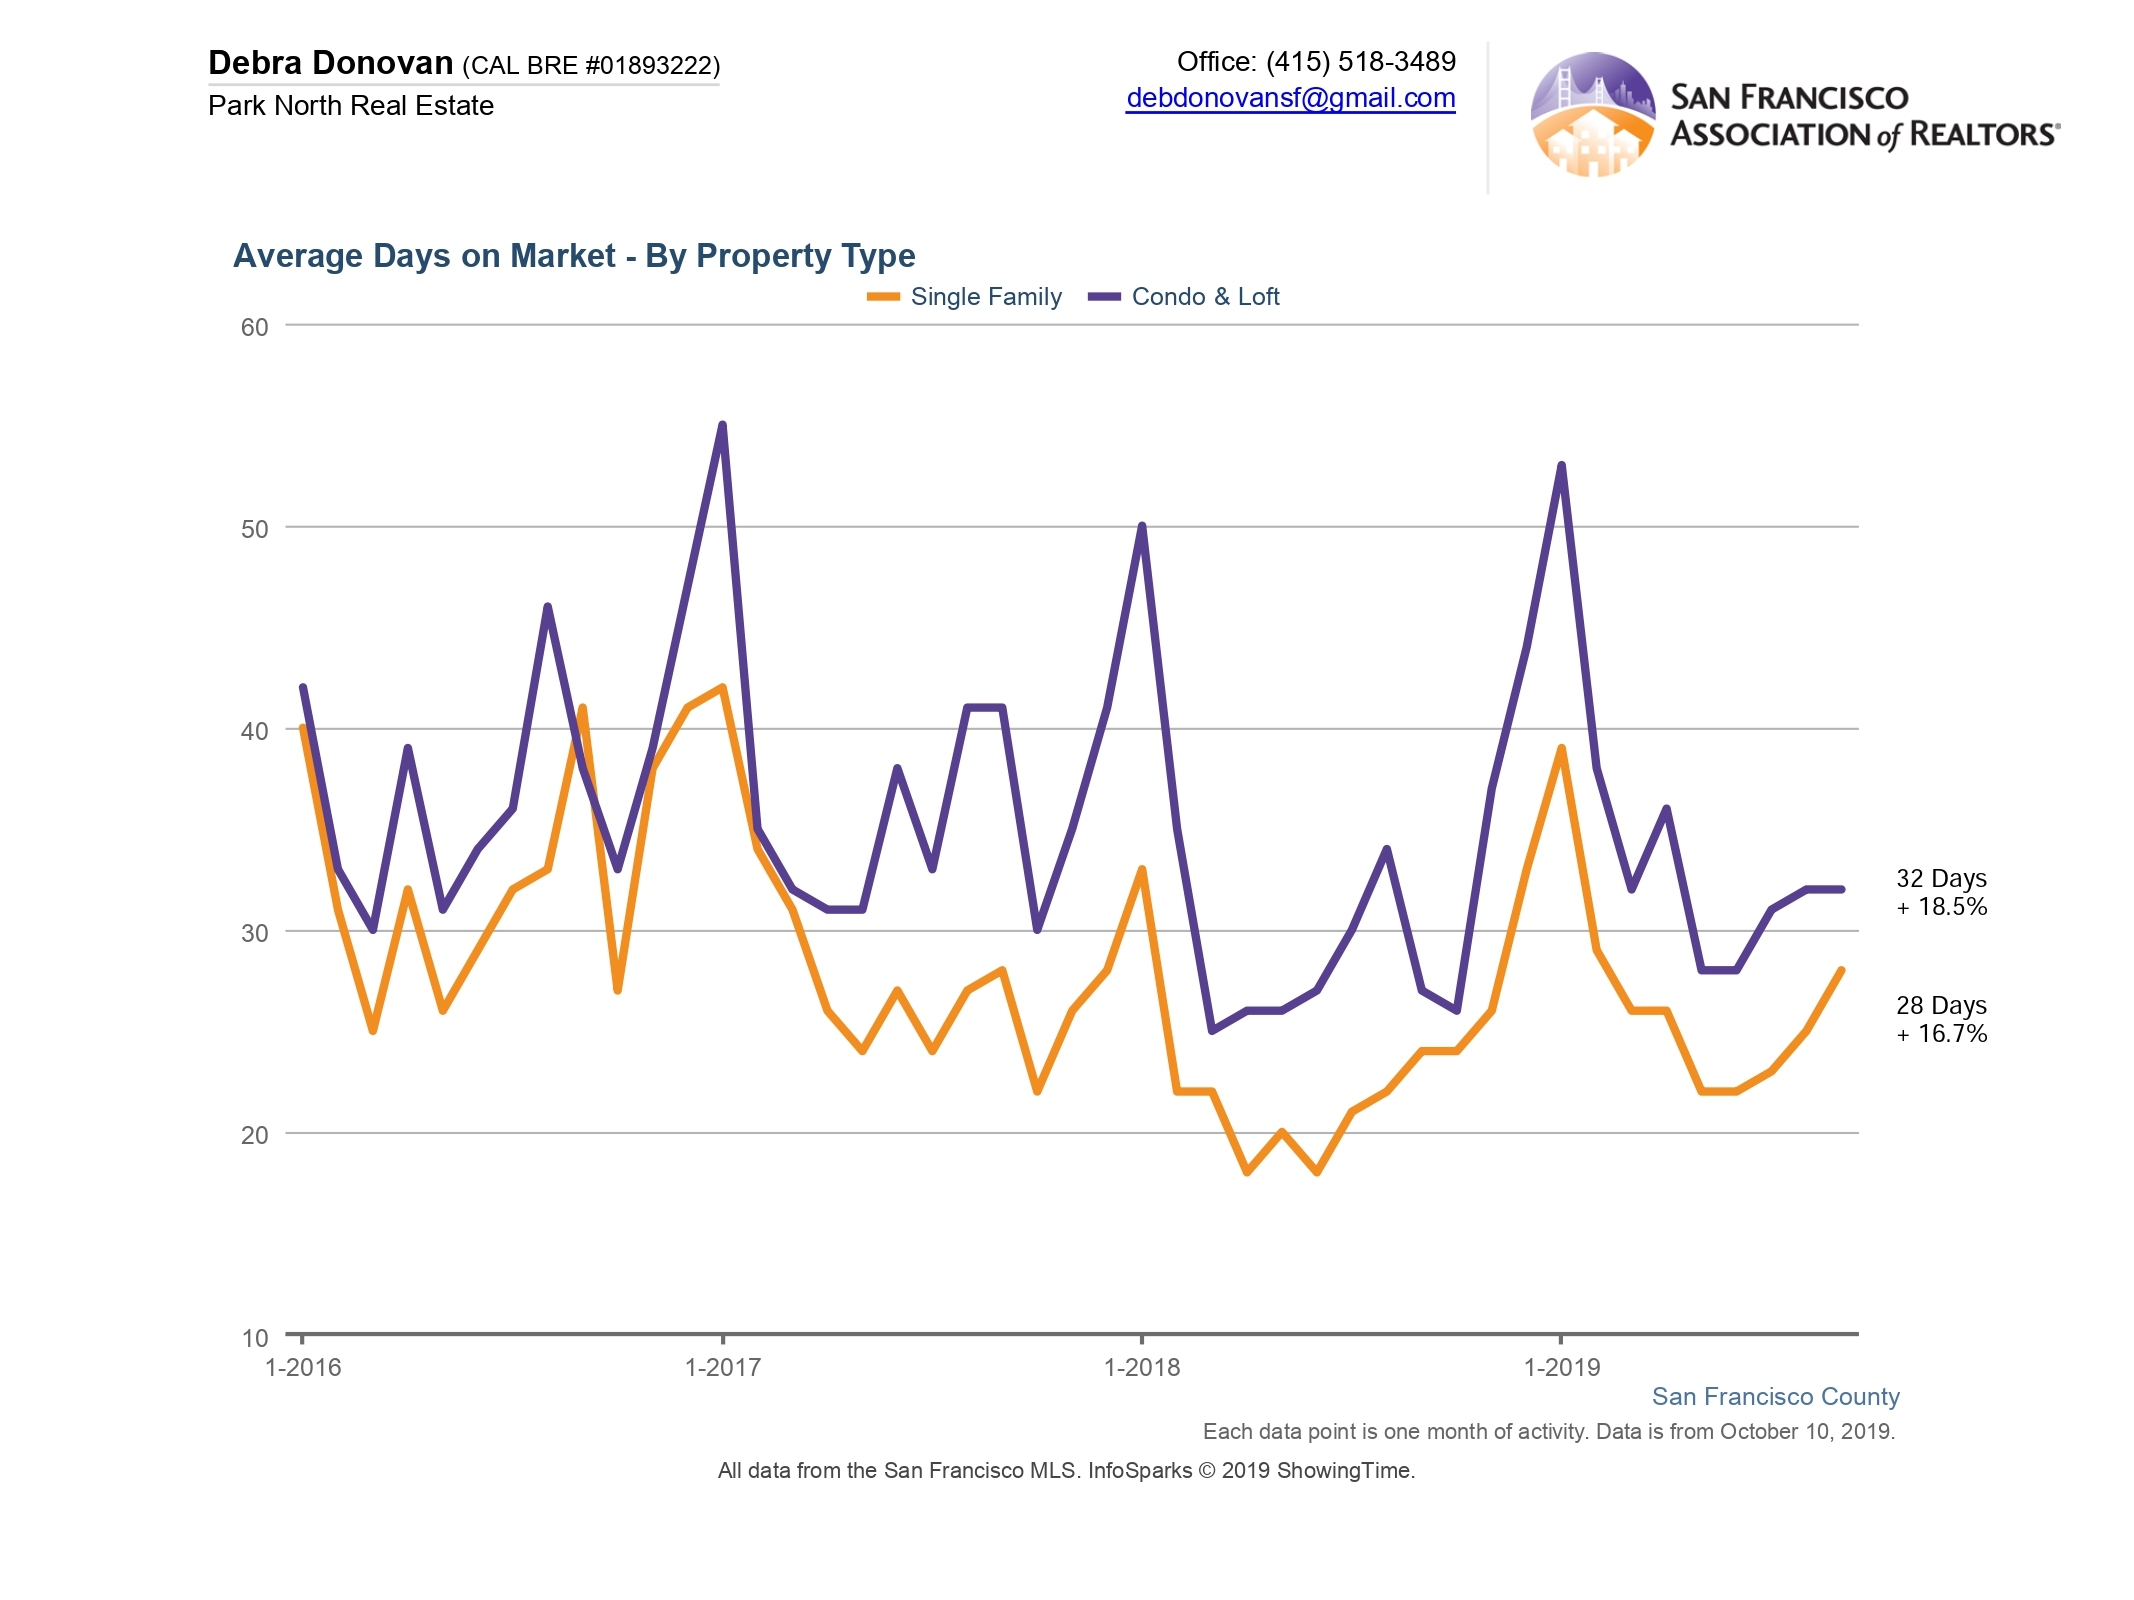
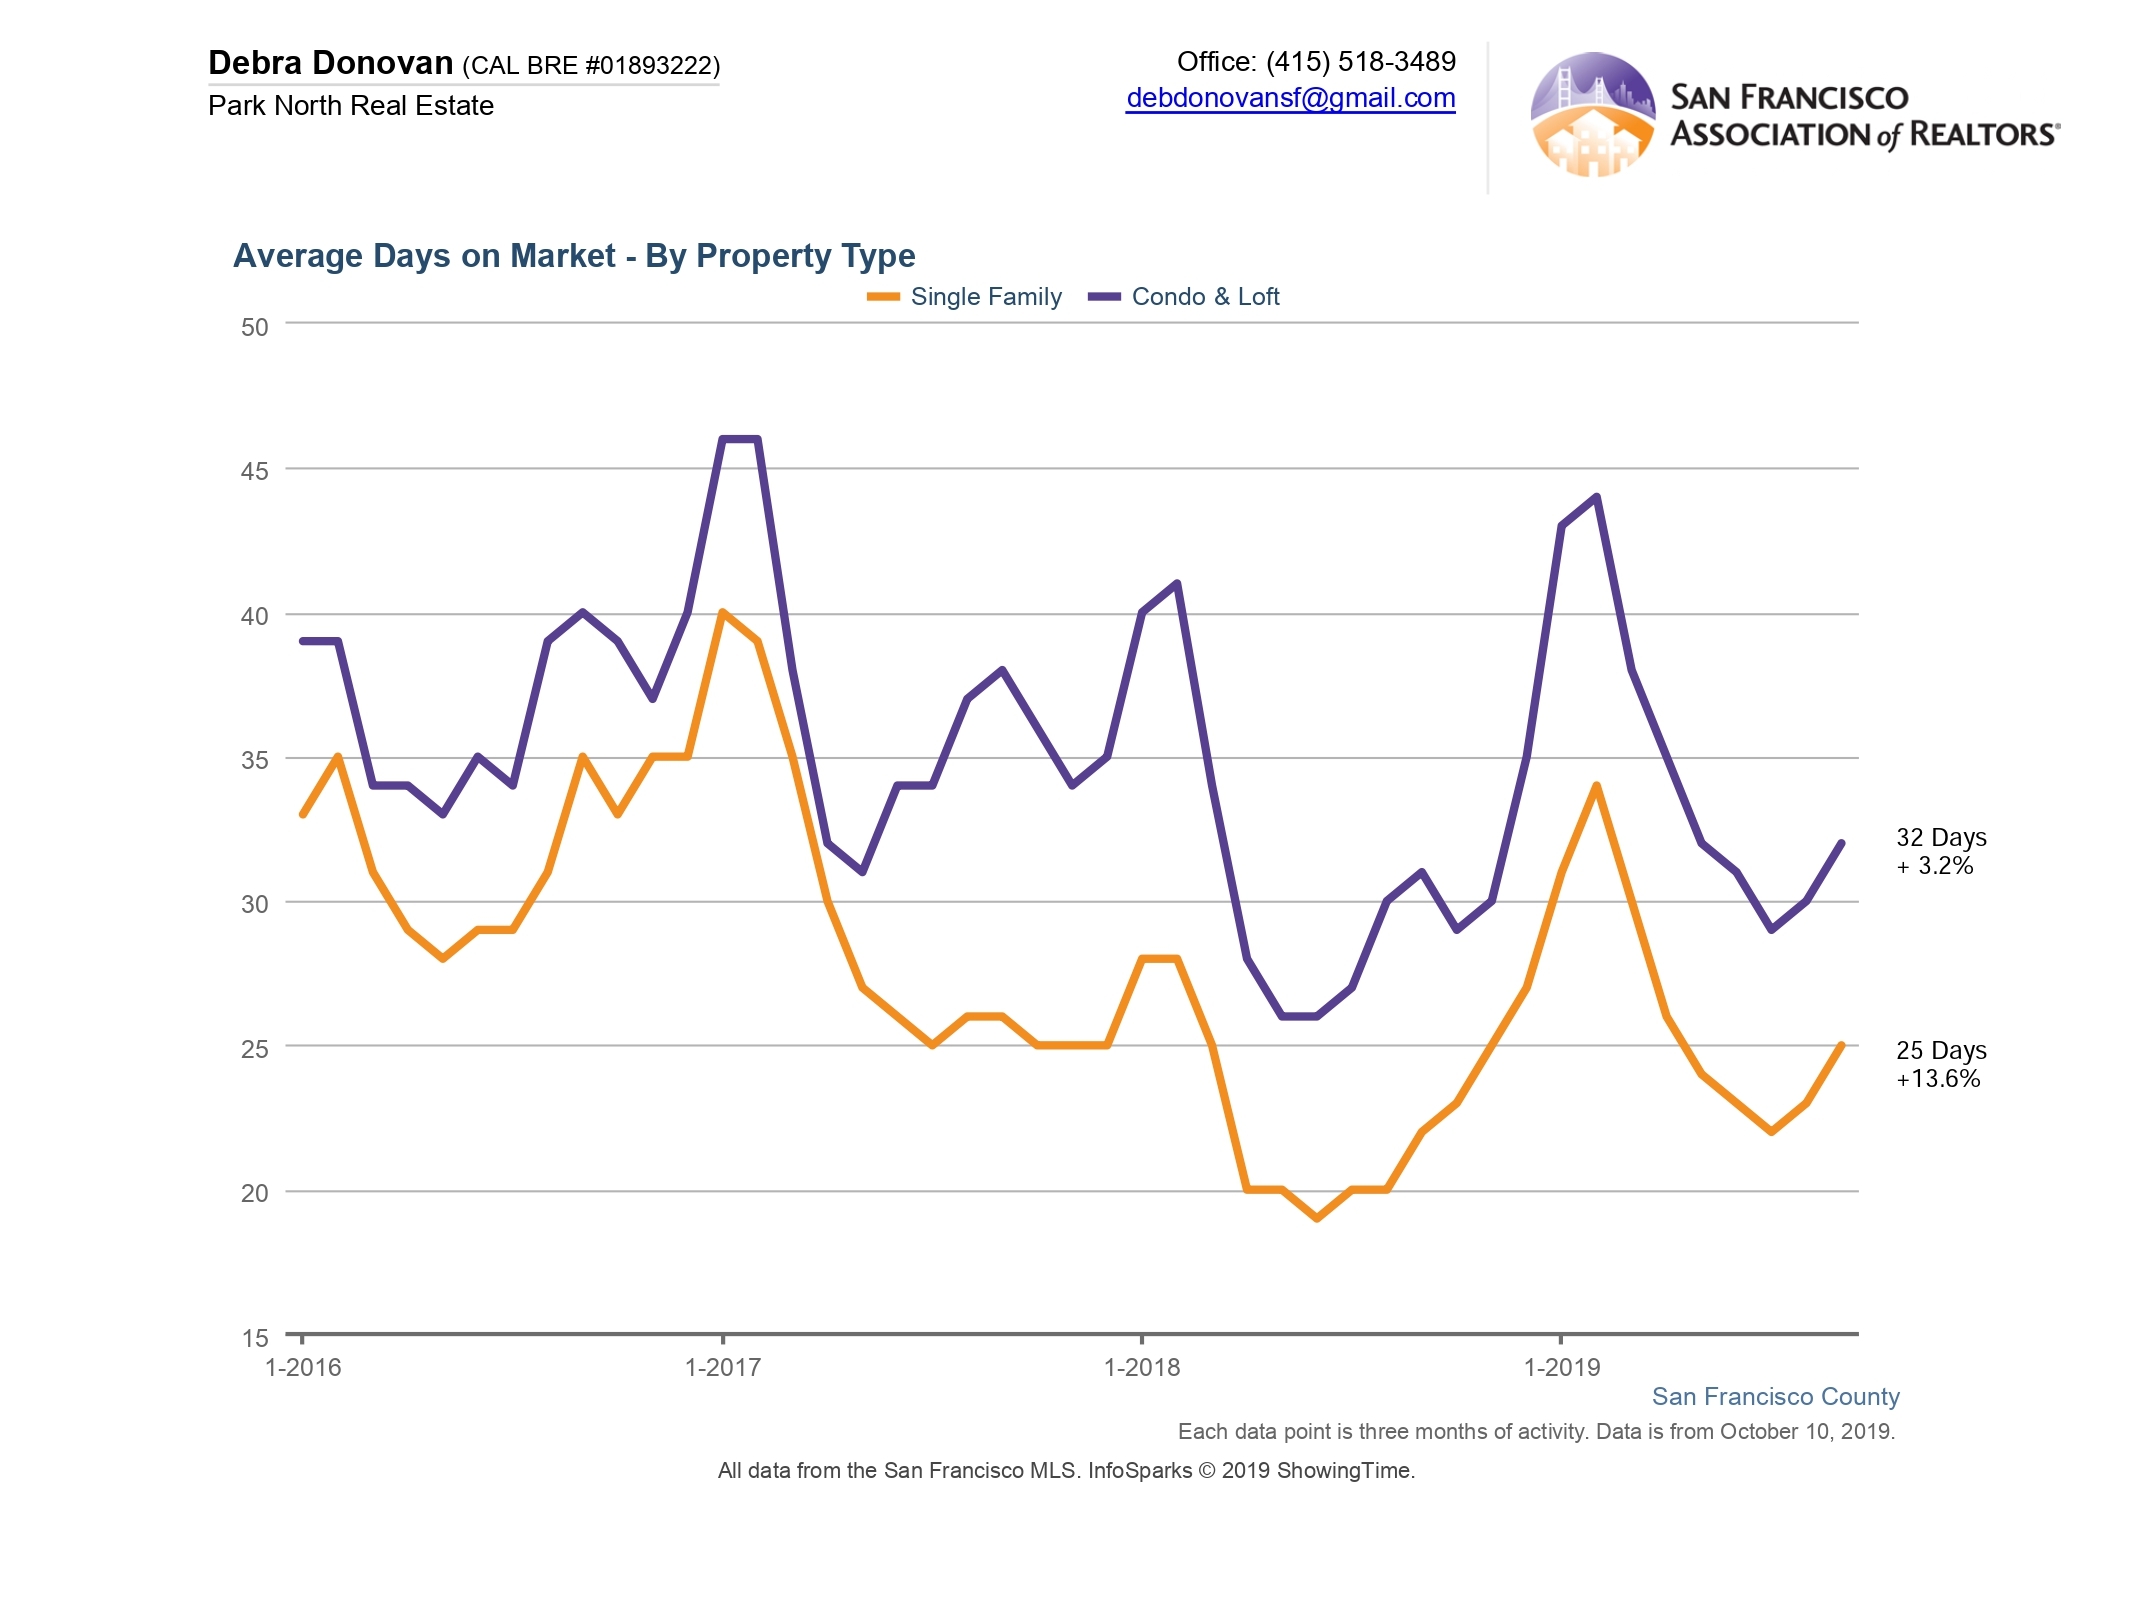
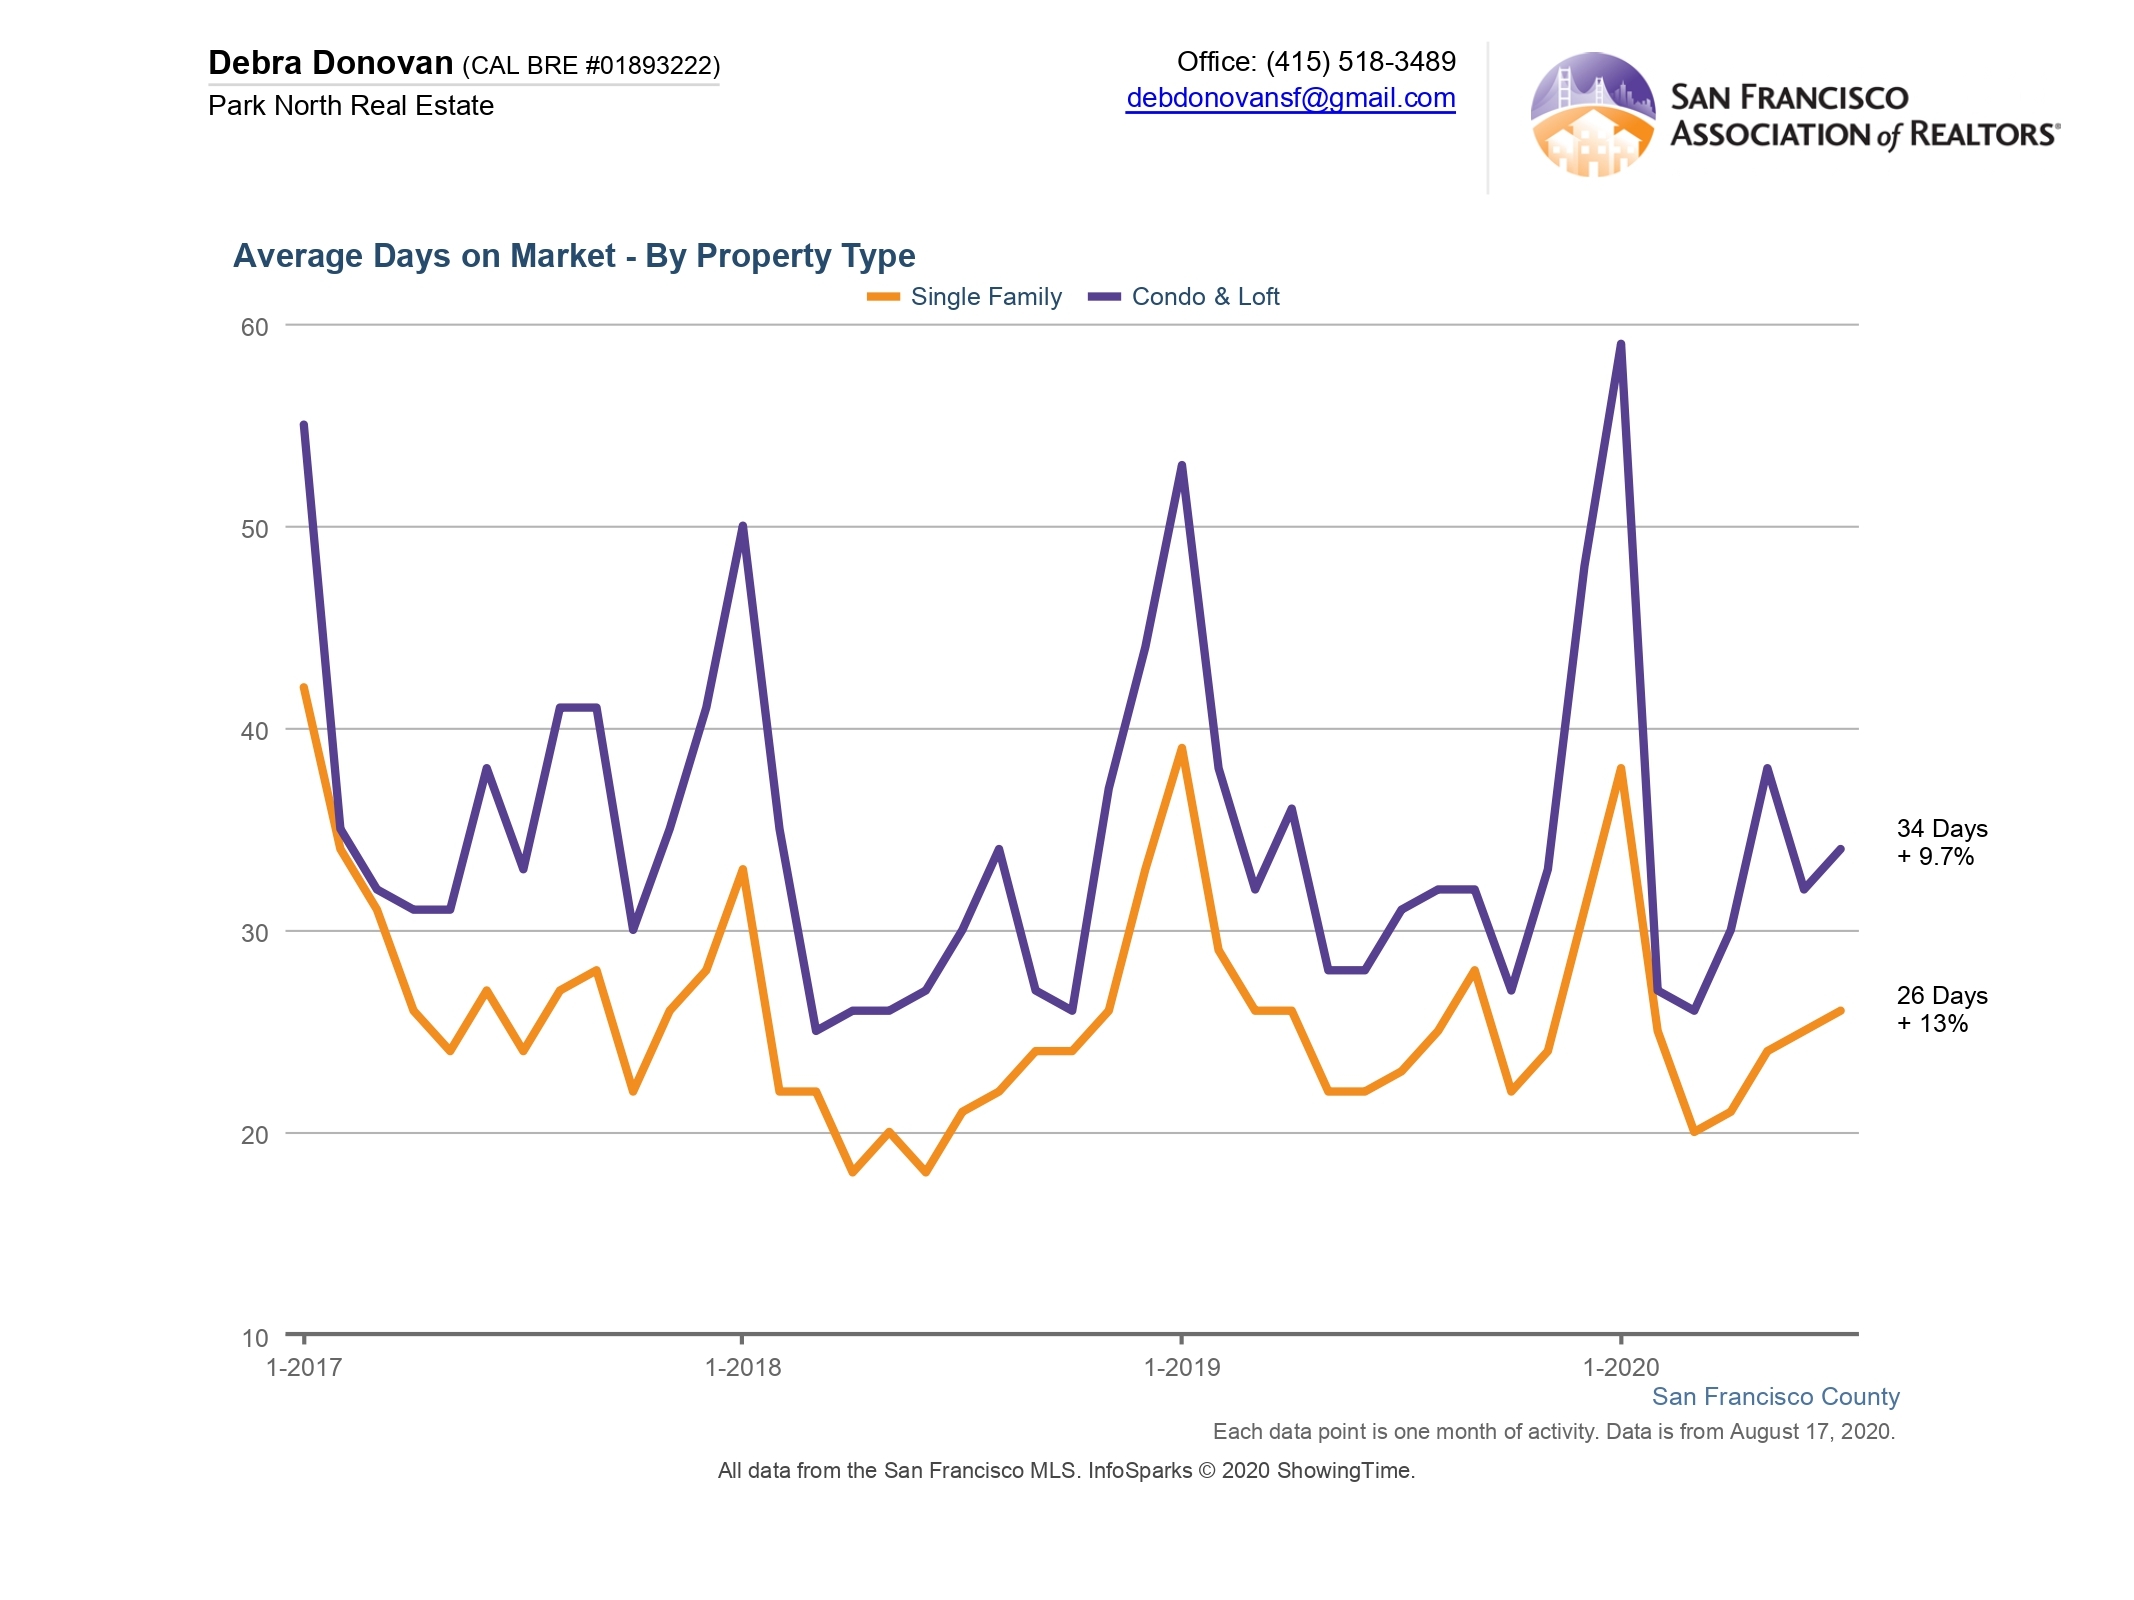
Average Days on Market:
Homes are still selling pretty quickly once in contract. Single family homes spent an average of 26 days on the market, up 13% compared to July 2019. Condos and lofts spent an average of 34 days on market, up about 10% year-over-year.
The fine print: All information deemed reliable but not guaranteed or warranted. Data comes from MLS so does not include off-market and most new construction condo sales. The San Francisco real estate market is dynamic so statistics can change on a daily basis. These statistics are meant to be a snapshot of the day and time they were pulled.